[Announcement] Update to Evaluation and Leaderboard

You may have noticed some changes on the leaderboard however, it is nothing to worry about. We have included a grid cost, D in addition to the normalized price, C and normalized emission, G costs. The grid cost is to encourage cooperative multi-agent RL solutions that when evaluated at the aggregated district level, improve grid-level objectives on average. The grid-level objectives that we have introduced are the reduction of ramping and 1 - load factor. See the following sections for more details on the changes to the evaluation and leaderboard.

What is the interpretation of the grid cost and grid-level objectives?

The grid cost, D is the average of the normalized ramping, R and normalized 1 - load factor, L costs:

D = \textrm{avg}\left(\frac{R_{entry}}{R_\textrm{no battery}}, \frac{1 - L_\textrm{entry}}{1 - L_\textrm{no battery}}\right)

R is the smoothness of the district’s load profile. Low R means there is gradual increase in grid electricity demand even after self-generation becomes unavailable in the evening and early morning. High R means abrupt change in load on the grid that may lead to unscheduled strain on grid infrastructure and blackouts as a result of supply deficit that is unable to meet the rapid increase in demand. It is calculated as the sum of the absolute difference of net electricity consumption between consecutive time steps:

R = \sum_{t=1}^{8760}{|E_{t} - E_{t-1}|}

L is the efficiency of electricity consumption and is bounded between 0 (very inefficient) and 1 (highly efficient). Thus, the goal is to minimize 1 - L. L is the average ratio of monthly average and maximum net electricity consumption and is calculated as:

L = \Bigg ( \sum_{m=0}^{11} \frac{ \left ( \sum_{h=0}^{729} E_{730m + h} \right ) \div 730 }{ \textrm{max} \left (E_{730m}, \dots, E_{730m + 729} \right ) } \Bigg ) \div 12

How is the grid cost reflected on the leaderboard?

There are two new columns on the leaderboard. Grid Cost displays the value of D and Average Score (with grid cost) is the average of normalized C, normalized G and D:

\textrm{Average Score (with grid cost)} = \textrm{avg}\left(\frac{C_{entry}}{C_\textrm{no battery}}, \frac{G_{entry}}{G_\textrm{no battery}}, D\right)

The Average Score retains its original definition as the average of the normalized price, C and normalized emission, G costs:

\textrm{Average Score} = \textrm{avg}\left(\frac{C_{entry}}{C_\textrm{no battery}}, \frac{G_{entry}}{G_\textrm{no battery}}\right)

In Phase I and Phase II, Average Score is used to rank submissions to keep the competition fair. Only by Phase III will Average Score (with grid cost) be used for ranking.

What does this mean for previous submissions?

Phase I and Phase II submissions that were made before ~ 2022-09-14 15:00:00 UTC will have Grid Cost and Average Score (with grid cost) columns blank. Later submissions will have values for Grid Cost and Average Score (with grid cost) however, neither of these scores will be used for ranking until the beginning of Phase III.

How does this affect future submissions?

Submissions made after ~ 2022-09-14 15:00:00 UTC will have values for Grid Cost and Average Score (with grid cost) but will not be used for ranking until the beginning of Phase III as with previous submissions.

What do I need to do moving forward?

All you need to do for now is to:

  1. Update to the latest CityLearn v1.3.6 to be able to view the grid cost in your local evaluation:

pip install git+https://github.com/intelligent-environments-lab/CityLearn.git@v1.3.6

  1. Design your agent to minimize the grid cost as done for the price and emission costs. While the grid cost is not utilized in Phase I and II ranking, it will become relevant by Phase III so best to start planning for it now :slight_smile: !
6 Likes

Hello!

A small suggestion to the ramping part of the grid cost

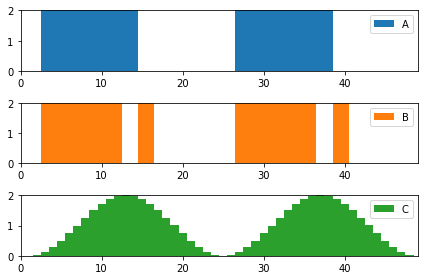
  • with the current implementation you don’t encourage a smooth load change. As an example here is an image with 3 load patterns, all consume the same amount of energy, and the ramping is A: 8, B:16, C: 8. In other words it is the same for buildings A and C, while I expect C is much more preferable for the grid.

  • a very simple adaptation in your formula is to take changes in load to the power of 2 instead of the absolute. Later, if needed, you can take a square root of the result, which will make the ramping as A: 4, B:5.7, C: 1.3.

abc

In any case here is the code for the example if you want to check:

import pandas as pd
import numpy as np

a = pd.Series(np.zeros(shape=48))
a[2:14] = 2
a[26:38] = 2

b = pd.Series(np.zeros(shape=48))
b[2:12] = 2
b[14:16] = 2
b[26:36] = 2
b[38:40] = 2

c = pd.Series(np.sin(np.arange(-np.pi*0.5,np.pi*3.5,np.pi/12))+1)

df = a.to_frame('A').join(b.to_frame('B')).join(c.to_frame('C'))

df.index+=1
df.loc[0,:] = 0

print((df-df.shift(1)).abs().sum())
print((df-df.shift(1)).pow(2).sum())
print((df-df.shift(1)).pow(2).sum()**(0.5))
6 Likes

Hello everyone,
Is it still forbidden to edit the user_reward.py file ? If I’m not mistaken, it’s the only way if we want to build a reward function with not just instantaneous electricity consumption, carbon density and grid electricity price

Thanks

1 Like

@thomascosyn please, see this README.md on how to define your own reward function.

Two questions:

  1. In the equation for L, is there a typo and did you mean to divide by 30 instead of 29? Since d ranges from 0 to 29 there are 30 days.
  2. Does the equation for L as provided here match up exactly with CityLearn’s implementation of the load factor? In the code, the window was set to 730, which equates to 730/24=30.42 days.

@kingsley_nweye: I have the same questions as Julio above

I have the same questions as Julio above

@julio_cesar_arroyo_i @cyeh @lai_le_thi apologies that this is coming late but it shouldn’t affect any outcomes of the competition. The divisor in L is 30 as pointed out. 29 was a typo.

To your other point, please use the implementation in the environment. I have rewritten the equation here to match what’s in the environment. 730 is used as the window since the actual timestamps are not made available in the environment to be able to partition by actual monthly day counts. 730 = “number of hours in a year”/“number of months in a year” (8760/12) and is an approximation of the monthly partitions.