Hello  Everyone,
I am seeing a lot of participants are trying out different things to increase the accuracy. Some of them work, some of them don’t, but how  do you track each experiment
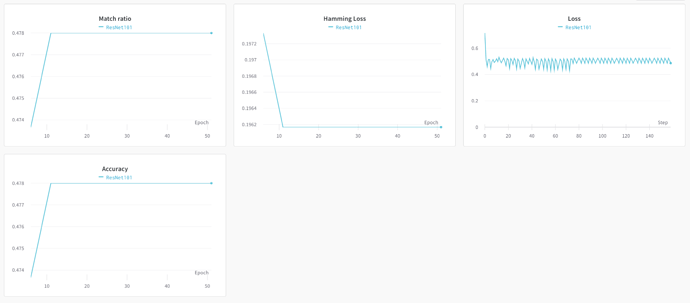
 In this post, I will demonstrate how you can setup an MLOps pipeline with WandB to track all your experiments and visualize them in a dashboard.
WandB helps you build better models faster with experiment tracking, dataset versioning, and model management. It enables you to track the progress of your experiments in real-time on your web browser.
Follow this notebook and by the end of it, you will be able to setup your own experiment dashboard in no time.
Please do let me know any improvements or questions in the comments below, I would be glad to help you.
Click on  if this post was of any help.
