Weekly Feedback // Evaluation clarification?

Hi all,

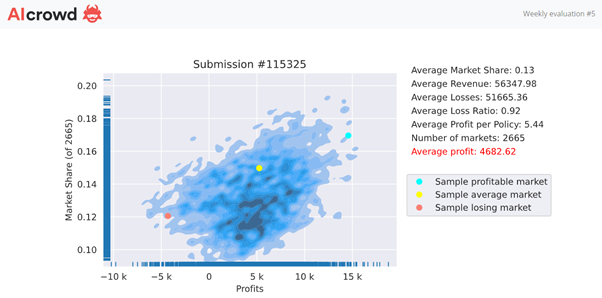
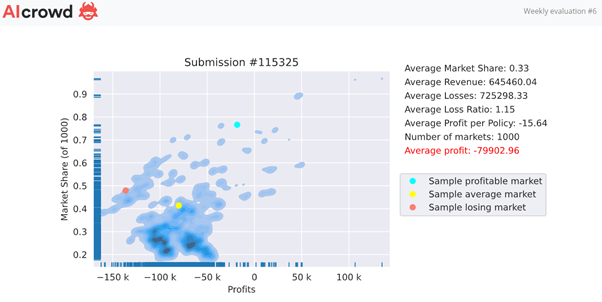
Last week, I shared my Weekly Feedback chart and associated thought process.. Looking at the distribution of my market and the market share %… I came to the realization that I had to go back to the drawing board.
 
:heavy_minus_sign: :heavy_minus_sign: :heavy_minus_sign: :heavy_minus_sign: :heavy_minus_sign: :heavy_minus_sign: :heavy_minus_sign: :heavy_minus_sign:

A new week, a new model, a new feedback…

This time ranked 8 on the profit leaderboard with a moderate $6420 avg profit.

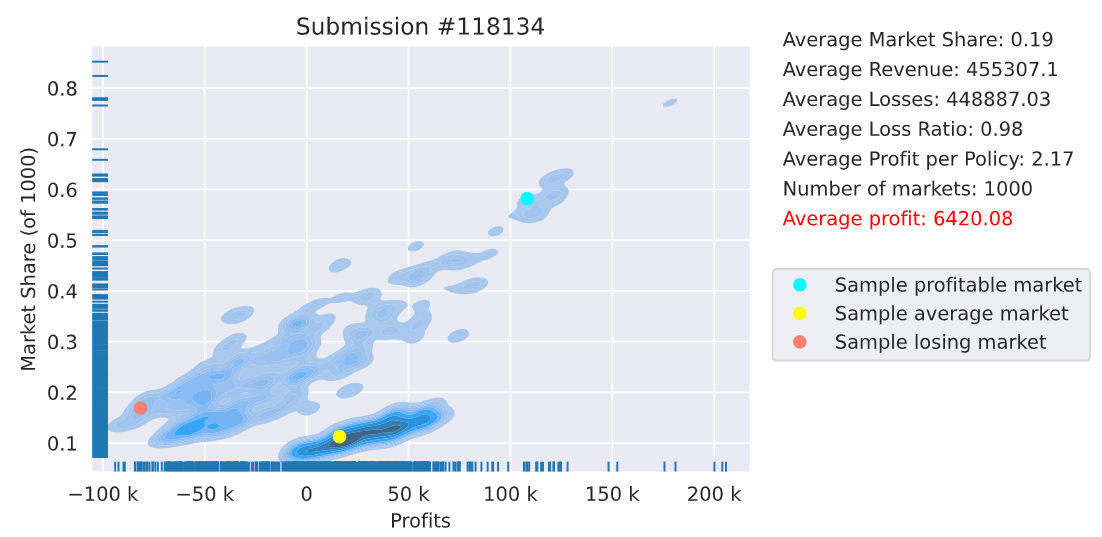
@alfarzan, this time, both set of metrics are in the same direction. :wink:


Thoughts on my results at initial glance:

  • The bottom cloud, being the bulk, low market share, “okay” profit.
  • The actual shape is interesting, going upwards from left to right…
  • … the more market share I have, the more profit I make (!?)
  • Looks like I will try to hunt for more market share.


Thoughts on the leaderboard:

  • top insurers are generating fatty profit, congrats.
  • and bottom are loosing,… a lot! taking the hits for the team.

 
:heavy_minus_sign: :heavy_minus_sign: :heavy_minus_sign: :heavy_minus_sign: :heavy_minus_sign: :heavy_minus_sign: :heavy_minus_sign: :heavy_minus_sign:

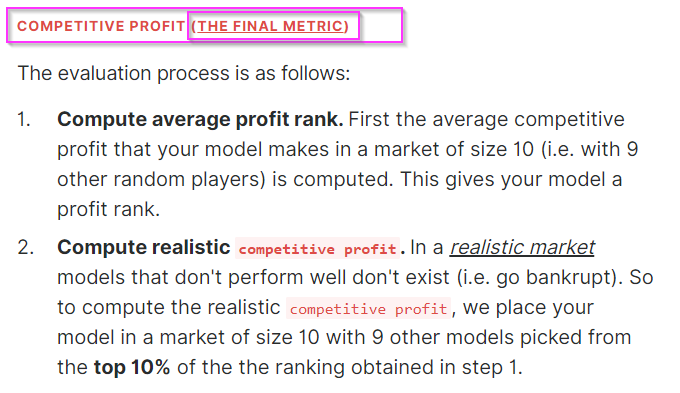
This is when I read back the evaluation and I’m looking for clarification.

To make sure that results are stable, we keep putting you in markets until your leaderboard rank no longer changes from market to market.

^That I understand.
But then further down it details even more the metric.

Is the realistic competitive profit computed in the weekly leaderboards? Or is that only for the end ?

Compute realistic competitive profit. In a realistic market models that don’t perform well don’t exist (i.e. go bankrupt). So to compute the realistic competitive profit , we place your model in a market of size 10 with 9 other models picked from the top 10% of the the ranking obtained in step 1.


I’m asking because I have a feeling, from my leftish top cloud, that those markets (the red dot :drop_of_blood:) , was when I got to compete against top insurers such as @simon_coulombe. :stuck_out_tongue_closed_eyes:

If “realistic profit” isn’t computed weekly, then I think I just got a glimpse of what’s to come next in March…

:bomb: dreaded adverse selection :skull:


EDIT: just noticed that the number of markets is only 1,000 (vs 4k+ last week). Is this normal? Are players subject to roughly the same quantity of market evaluations? I can understand slight variance to account for convergence, but this is a significant difference between two weeks.

My guess is that you reduced market quantity to offset the computation required for the extra rows?

4 Likes

I love this post :heart: mainly because it is showing the development of your strategy :bulb: without revealing much.

To answer your question, every profit leaderboard (including the weekly leaderboards) are computed using the realistic competitive profit.

On another note, I should say that there is no guarantee that the top of the round 1 leaderboard are actually within the top 10 of round 2 all the time :slight_smile: Sometimes they are, but sometimes they are just top of round 1 because they kept playing against less sophisticated models in round 1. In that case, they lose their positions :chart_with_downwards_trend:

1 Like

Ok, thanks, good to know as the main page only highlights this “realistic competitive profit” under “THE FINAL METRIC”. This is why I got confused.

finalmetric


Also, I did a ninja edit as you were replying.
Could you comment on the number of markets gap between Week6 and 5? See bottom of OP.
Thanks :slight_smile:

1 Like

Ah good eye :eye:!

I was hoping that would go unnoticed, but the answer is interesting and I will share it.

Our previous approach :robot:

As you know, the evaluation metric is the average profit.

For the first 5 weeks we were computing this by running thousands of markets and gathering the results.

However, 3 developing features of the game meant that this approach would be inefficient going forward:

  1. Growing number of participants
  2. More sophisticated feedback for each participant
  3. Increased dataset size

Our new approach :sparkles:

Given that these are cheapest wins markets and we know the exact values for the prices of each participant, that meant that we could analytically compute the average profit numbers ourselves. This is what we do now.

The intuition :thinking:

The difference between the simulation and analytical approaches is the same as the difference between rolling a dice many times to understand the probability is 1/6, Vs doing that through combinatorics. That’s it!

Does it change anything? :question:

The short answer is no. In fact, this makes things more accurate than before as the rankings are analytical rather than an approximated value. The actual difference between these two methods is marginal and practically unnoticeable in the context of the game. At least that is true for the past 5 leaderboards.

So, what is “1000 markets”? :chart:

Well, to give you the feedback plot and the information about the three sample markets, we still have to actually simulate some markets. After some sensitivity analysis over the results of the previous 5 weeks we found that running 1000 markets is sufficient to give you information that approaches the analytical solution with enough precision that any discrepancy would not appear on the feedback.

Note: All the data from the tables except information about the three sample markets is also the result of the analytical solution.

I hope this clears things up a bit more :slight_smile:

3 Likes

As always, detailed and helpful explanations coming from @alfarzan.

Thanks!

Oh, and thanks for the chuckle…

I was hoping that would go unnoticed

:joy: not with me!

3 Likes

Maître @michael_bordeleau , sur un arbre perché… :slight_smile:

This competition is strange. There is basically no relation between the RMSE leaderboard and the profit leaderboard. No one from the RMSE top 20 has made a profit (the submission I use would be 30th on the RMSE leaderboard).

I also have a similar relationship between market share and profit and my loss ratio is also so high that I can’t afford to lower my prices to hope to increase my market share.

That being said, I don’t think the relationship is “higher market share leads to higher profits”, but rather “weak competitors dont have low enough prices for good risks, which means I get to sell to all the good risks (high market share) and make profit from them (high profit)”. Basically, there’s nothing I can do from that information.

Holy shit, how did you even get a 60% market share in a single market? Even playing against 9 models that just returned the mean shouldnt allow that.

1 Like

Lol, not sure if I should tell after that corbeau intro. Too many :fox_face: :fox_face: :fox_face:

Jokes aside, you have a really good point. It strengthens your argument of some weak competitors in the bunch.

1 Like

One reason that can explain why top RMSE leaderboard are not in the top profit leaderboard, is that they overfit too much the claims estimation, considering their claims estimation is more or less equal to the premiums they offered.

3 Likes

@alfarzan

Dear alfarzan,

Although you have my total trust that the change in calculation do not change anything on the final leaderboard.
It has a huge impact on how to read the feedback we get.

Let me elaborate on this and always based on the assumption, that I understand you right.

You mentioned, that now you can analytically compute the average profit numbers. As you not anymore create sample markets I would assume you calculate that by predicted premium - observed claims.
Based on this your top 10% of the market totally change. In the top 10% there are mainly persons who totally overprice everything. This would also explain, why me and @michael_bordeleau market share increased significantly (last submission michael was below 1% market share and i would not assume, that he increased his prices so substantial that getting a market share of 40% would make sense).

Overall by changing the calculation of the top 10% your comparison base totally change and market feedbacks cold not be compared anymore…

Hi @fxs

I understand the concerns here. Any small change to a metric can be concerning. In this case the metric has not changed, only the computation of it has changed. It’s still a two round metric and each round has to go through the same process as before.

More detail on how average profit is computed :robot:

The average profit computation is not simply average of premiums - claims for each model = average profit. There is no market computation in that.

What we do here is that we use the fact that we know:

  1. Everyone’s prices for every policy
  2. The size of every market (= 10 players)
  3. The cheapest price always wins the policy

Using these three you can compute analytically the probability that in any given randomly populated market, a specific model will win a specific policy. In other words, we can analytically compute the conversion rate (probability that a model win a policy, given their premium prices). Once we know the conversion rates, the rest of the statistics become trivial to compute. The conversion rates come out of the market competition algorithm computed analytically.

We use a similar intuition with one more level of complexity for the second round of the metric.

How do we know this changes nothing? :lock:

The short answer is: we check!
Before deploying the new computation we computed the full feedback and leaderboard results using both the simulation method and the analytical computation. We did this not only for week 6, but for the 5 weeks prior as well. Just to be sure that we did not make a mistake or miss a key detail.

Very very few models change their round 1 or 2 rankings as expected. We get almost indistinguishable results. This includes what we give out in the feedback to you.

To give you some numbers, upwards of 99% of the leaderboard does not change. In the handful of cases that it does change, it is quite a minor change and it would be because the analytical solution is more accurate.

Why are you getting a larger market share? :thinking:

Now to the real question, the changes in market-share you are seeing is largely due to the tripling of the dataset size rather than the analytical solution. With more data you get a larger variety of policies and so you can find your niche within each market with more ease.

(Also I think you meant to say that Michael has not decreased his prices to get more market share, as an increase in prices would have the opposite effect)

I hope this gives you some peace of mind, and please let me know if you have other concerns :ballot_box_with_check:

Good luck Michael with the strategy for gaining market share to improve profit.

I had the winning model for week 5. I kept it unchanged for week 6 and we can all see what happened I ended up in 63rd position. Given my current strategy isn’t giving consistent results I’m going to change it so feel it’s OK to share my feedback from weeks 5 and 6.

In week 5 I wrote a market share of 13%, avoided any large claims (maybe there weren’t any) and managed the following.

image

Looking good I thought, so let’s leave it unchanged for week 6… Ouch…

image

So there are few things of interest.

First, I gained market share. That shouldn’t surprise us… as a market on average we’re doing a good job of losing money, so I could believe that market rates are rising as the weeks go by.

Second, gaining market share means an increased likelihood of picking up large claims. It looks like there were 3 large claims (given claims are now capped to 50k) in the week 6 market and lucky me managed to pick them up more often than not.

If you believe large claims are predictable and you’ve set your rates accordingly then they shouldn’t worry you.

But if you think they are largely random then we are all playing a game of chance. In that case I suspect the lucky winner will be someone who sets their rates at an uncompetitive level, writes a small but profitable market share and avoids the large claims to take home the prize.

Time will soon tell, but in the meantime I’m going to go back to the data once more to see what I can make of the large claims. An then I had a cunning plan to prevent me from repeatedly picking up the large claims in the leaderboard calc which @alfarzan has just scuppered by declaring that the leaderboard is now calculated deterministically rather than by simulation as was the case!

4 Likes

Thanks for the post, this is super helpful. I still haven’t figured out how to really interpret/benefit from the weekly detailed feedback. Can you elaborate on how you determined that there were “3 large claims” in the week 6 market?

The profit of nigel’s model has 3 clusters around -150k, -100k and -50k which suggests it takes up 1-3 large losses in these clusters.

The x-axis is profits for a market though… the Average Losses is 725298.33. What am I missing? Does each “market” have a pretty small size of policies being bid on by the 10 models? I didn’t think so because the average revenue and losses are sizable. I must be misinterpreting something…