Week 7 feedback (and some thoughts)

Hi @alfarzan
I have to admit that our team is a bit puzzled upon the results - the point is that we feel that the weekly profit dashboards results are too erratic: how is it possible that people that were in the first positions last week now fell around the 100th position whilst other people, who did not update the model since december, move from the latest positions to the top? we are starting to suspect that there may be something related to the portfolio size - if we interpret well the rules, even if we now have 18k rows, if you get a market share of 10% (considering “uniform” market share between the players), it means 1800 policies … which in insurance terms is basically peanuts/highly affected by volatility (as we cannot purchase reinsurance)!
=> and yes, we can argue that with the 1000simulations, the “luck” should be stripped out - but if someone gets always the same policies (more or less) and gets the same (random) losses, eventually it doesn’t matter …

just some food for thought: a proposal from our side would be to play each week the weekly profit leaderboard on the portfolio size similar to the 100k target one (or a much bigger sample than it is currently) - are there any other similar thoughts/feedback from the rest of the community or we are the only ones feeling a bit puzzled?

2 Likes

Recall that the rules did say that with each successive week, the portfolio will gradually shift from Year 1-heavy to Year 4-heavy. And most of us would have trained our model using the full 4 year data on our own computer before uploading. It is very plausible that people who have never updated their model since Dec have built a model meant for companies that have 4 years of data; and therefore performs badly in the first few leaderboards.

1 Like

Thanks for your comment - to clarify my remark: we refer more to the fact that we can observe easy swings of 100 positions between one week and the other for most players … if your model is really good, you should always be in the top10 (similar to poker players) - but it seems this doesn’t happen … so we are just wondering how much meaningful is the weekly dashboard to predict the final outcome …

I would clarify that the current profit leaderboards do not have any of the policies from the training dataset.

///////////////////////

My general comment is that it does seem like luck is a very important factor in the weekly profit leaderboard.

But I’m also starting to suspect that the inactive insurers (those no longer actively involved in the competition) are distorting the results.

As you pointed out, plenty of insurers have stopped submitting early January.
Notice how some are accumulating significant losses (in the millions $).

Am I wrong to think those insurers could be sabotaging our closing ratio? Underpricing and not caring about the losses? Resulting is us active participants, with very small market share to play with, and thus, being more heavily subjected to the random nature of claims?

Perhaps the best way to find out is for the crew to run a simulation excluding inactive participants?

2 Likes

Am I wrong to think those insurers could be sabotaging our closing ratio? Underpricing and not caring about the losses? Resulting is us active participants, with very small market share to play with, and thus, being more heavily subjected to the random nature of claims?

This gut feeling is reinforced when I take a look at the RMSE leaderboard. I would think a better RMSE would generally lead to better profit in a world with million of policies priced…?

(However, I would love to know if @MakePredict is confident that he’s not over-fitting the hidden test data, with 443+ submissions :wink: )

So yeah, basically I think Randomness + Inactive Insurers are creating these swings. I’d love for anyone else to chime in on this.

1 Like

Are you sure that the profit leaderboards are not based on training data? To be honest we understood that each week they took a 18k sample (gradually from year 1 to 4) from the training dataset - where did you read otherwise?:slight_smile: And don’t you think that 18k*market_share are indeed not enough policies to ensure a stable portfolio?

half of those are failed though

Hey stop dunking on old models! I’m still using my model from Christmas day and I’m reluctant to let go since it got e 4 podiums in 7 weeks :slight_smile:

Between the « mean models with no markup that should take 50% market share and the « basic models with no profit margin » that take a large share of the remaining half, there isnt much left for us to sell. That being said, these models are also losing a lot, so once you make it to the second round all the crappy models should be gone.

I’m not sure what exactly goes on with regards to the two rounds system.

Are the market feedback we get only related to round two?

If a model doesnt make it to round two, then what is reported in the leaderboard?

A 10 000 grand loss is much more « shameful » when it happens in round one vs the starter kits than on round two against the best.

Also, something may have happened in the reporting, because my market share increased a lot between week 5 and 7, and it is the exact same submission

1 Like

Hahaha, it was a sneaky way to get you out. :see_no_evil: :speak_no_evil:

1 Like

The profit leader board each week is based on the “Round 2” runs where you are pitted against the top players after the “Round 1” runs. Unless many of those dormant models came in top in “Round 1” run, it would not affect the leaderboard result.

1 Like

If they don’t make “Round 2”, those models are just not used repeatedly to compete with the rest of the players. They themselves still have to play against the top folks from “Round 1”.

1 Like

Oh… and I have very drastically changed my pricing model. So other players may have picked up a lot more policies that I had in Week 5 but no longer in Week 7. (I had 40% market share in week 5, and single digit % in week 7.)

2 Likes

Ooh I get it now.
Everyone plays in round 2, even if you didnt qualify as a « good model » in round 1.

That makes sense.

I’m pretty sure people changed their strategy, I ´m surprised at how much.

I’ll leave everything unchanged for week 8 and report back if it was a fluke or not.

1 Like

Oh wow where to start :slightly_smiling_face:

A lot of really good discussion is happening here :muscle:

I’ll just chip in with a few thought and to address some questions raised above.

Some clarifying facts :writing_hand:

  1. Leadeboards do not contain any training policies (@sandrodjay1)
  2. All feedback, and leaderboards are based on round 2 of the markets (@simon_coulombe)
  3. In round 2 everybody plays against the top 10% of round 1 (including the top 10% themselves) (@simon_coulombe)

Ok now that we got that out of the way, the interesting stuff :point_down:

Effect of leaderboard size :racehorse:

@sandrodjay1 mentions that with a larger portfolio within your grasp then these large swings should be diminished. This is only partly true. There is a positive effect because of:

  1. Large claim buffer. A larger portfolio protects you against the impact of large claims.
  2. Representative sample. A larger portfolio is more likely to closely resemble the final dataset, and hence represent your claim estimation overall.

These two reasons are why we bolstered the dataset size and introduced reinusrance (i.e. capped claims).

But how effective is the size? Actually let’s see the underlying analysis behind this.

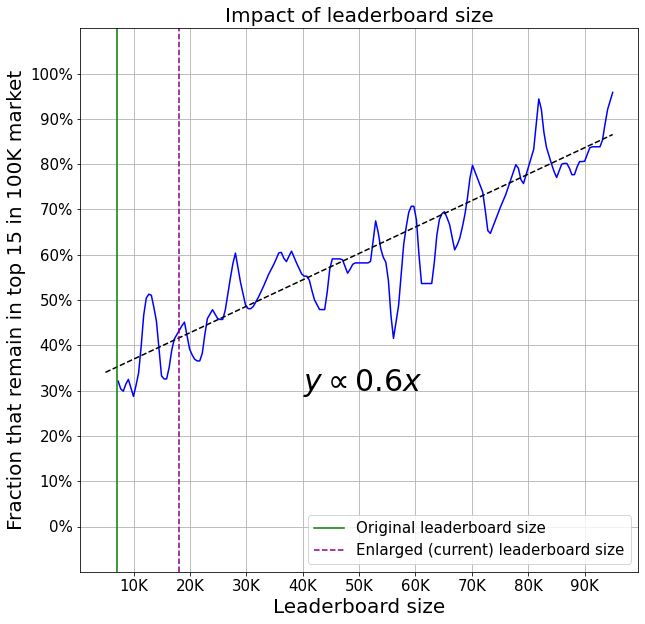
Here is a plot where on the X-axis you can see larger and larger samples of a set of 100K policies. On the Y-axis you can see the fraction of models that remain in the top 15 models when the size is increased to 100K.

So you can see, roughly speaking, that for every 10K rows added, you’re getting 6% more in models that remain in the top 15. (For top 10 the growth is faster but has a lower starting point, the reverse is true for the top 20). Right now that number is close to 40%.

Note: remember that these are the same models engaged in markets with different sized leaderboards. If we also use different models the Y-axis values are slightly lower.

Why didn’t we just give you a huge portfolio?

There are 2 key reasons for this:

  1. Realism. We didn’t want you repeatedly price the same policies and get feedback about them.
  2. Data limitations. Because we don’t want to allow multiple pricing of the same portfolio we have to make the data go for 9 weeks or more. 20K was our limit :stop_sign:

We had to strike a balance, and given that in real markets any year you may see some swings, we decided that this is a good trade off. Of course models that have good claim estimation and a great unique strategy will come out on top much more often than others, while some may only have their “15 minutes of fame”.

So you can see that the swings exist and may be large for individuals, but for the leaderboard, they are not that bad. But if size is not the whole story, what else?

Fierce competition + no cumulative leaderboard = large swings :fire:

In the real world, we don’t see these large swings for many reasons. Some of the more obvious of these are:

  1. Complex customer behaviour. Markets are not cheapest wins
  2. Dataset advantage. Incumbents have large dataset advantages in their respective niches
  3. Leaderboard frequency. Frequency of real-world “leaderboards” is closer to yearly

These 3 points alone make the real-world markets a little more consistent year by year (my intuition is that the importance is (1) >= (2) > (3)). There are many other factors, such as very strict regulation, that also play important market stabilising roles.

In this challenge, leaderboards are faster :running_man:t2:‍♂, customers are extremely disloyal :smiling_imp:, and there is no incumbent dataset advantage (after all we want everyone to have the same chance!).

There is only claims modelling and pricing strategy, keeping all else the same.

So what can happen is that there can be large swings for some of the ranking positions when, due to small changes in pricing strategy or modelling, suddenly one model is constantly beating another.

Why did we go with such a setup?

  1. Simplicity. We wanted to make sure that the setup is very easy to understand.
  2. Accessibility. We didn’t want people joining in week 4 to be severely disadvantaged due to some missed dataset advantage.
  3. Fun. We decided on the weekly profit leaderboard rather than something like monthly

With all this in place, it still looks like we do have some of the top market players already recognised, but as with any competition (especially this one), that can change towards the end :rocket:

But of course we’re still learning how to build a market in a realistic way! so keep the thoughts coming :bulb:

4 Likes

Super informative and detailed post as usual, thanks @alfarzan

Honestly can’t come up with easy tweaks to make the competition better with regards with regards to when to use your policies. I also wouldnt go for more than 1 profit leaderboard per week.

For a future competition maybe introduce a point system similar to Formula One racing for the last ~5 weeks ( The winner receives 25 points, the second-place finisher 18 points, with 15, 12, 10, 8, 6, 4, 2 and 1 points for positions 3 through 10) to make it less likely that a random model makes it to the top.

Maybe make the last week worth thrice as much to keep the suspense

1 Like

Thanks @alfarzan - your reply is very appreciated: many thanks for taking your time to reply :slight_smile:
Eventually, let’s be fair, this competition it is a bit like a poker tournament - very likely the best will arrive in the the top10, but the actual ranking between 1 and 10 will be fairly driven by luck. And having the weekly feedback cannot really help to reduce the final luck, but rather to be (ideally) in the top10.

And we overall agree that, for a future competition, very likely mechanisms like the one recommended by @simon_coulombe would indeed help in the future to have a “fairer” system.

Said this, eventually let’s remind it is always a “game”, with all its constraints and assumptions - so eventually, let’s have just some fun :slight_smile: and thanks again for all the efforts you are putting on the organisation: we do really appreciate the complexity here and we understand why we are facing these limitations

2 Likes

Thanks @alfarzan I am impressed with all the efforts you take.

One further question.
For the weekly leaderboard do you use the models which have been trained on the training data provided or do you newly train the model based on other data?

Thanks

1 Like

Hi @fxs

All models we use are a-priori deployed using the output of your load_model function, so they will be your trained models. Re-training is not currently happening, however, we may run this check for the final evaluation. That will be confirmed soon.

Thanks @alfarzan for these explainations.

One additional reason for the higher stability of real market is the better underwriting knowledge : insurers know on which segments they have high / low conversion rate, and have some idea of their competitors price. This feedback loop plays a major role to help the prices “converge” and stabilize.This feedback is not available here, as the weekly feedbacks provide (I believe) very insufficient conversion information. This is a reason why I would suggest a per-profile conversion rate. Other information like sharing the players profit-margins and market shares (which would be more or less public information in the real world) would also help stabilizing the market… if it is still time to do so before the final week.

2 Likes