After the first leaderboard we noticed that many models were not passing the participation requirement (i.e. they were having a market share of 0 in more than 95% of our 1000 or so markets).
Upon investigation we tweaked how the markets were being constructed which now allows many more models to participate. All is now updated including the leaderboard. You will notice some changes on week one due to this but I am happy to see our top players are still in the top 10! Most importantly many others have entered the fray
2 Weekly leaderboard history
You will see that we now have a separate leaderboard for each week so you can see how the market rankings have changed over time, week-by-week. For example you can see that 4 of our participants are within the top 11 on either week!.
From this week onward you will be receiving the following feedback in your email after each leaderboard:
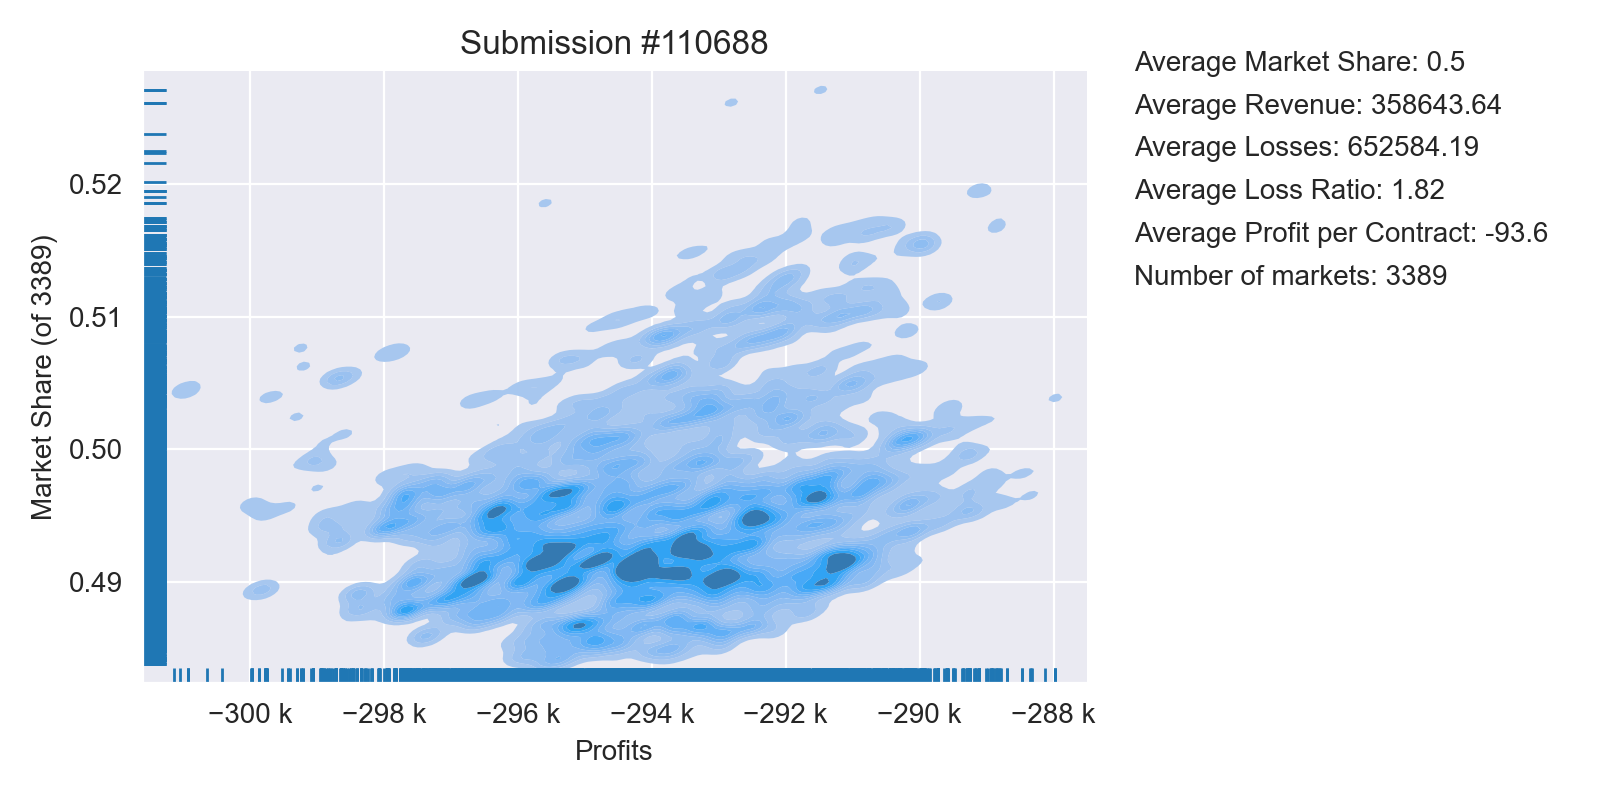
Market-share Vs profit. This will be a plot that shows how your model performed in each market it was placed during the leaderboard.
Market summary statistics. These will be the following summary statistics:
Average revenue
Average loss
Average profit-per-policy
Average loss-ratio
Average market-share
Total number of markets that you participated in
We will send out this information for both leaderboards for those that had valid models.These plots are currently being generated and will be sent out shortly.
We are still evaluating the best way to give you dataset related feedback as well if possible. So stay tuned on that next week
4 RMSE leaderboard is now fixed
Lastly there was an issue with the RMSE leaderboard not getting updated in real time due to a display issue. This is now fixed, and we apologies for the brief malfunction.
Hi @alfarzan,
Would it be possible to get some further details about the reason that resulted in a submission to be excluded in the from the Average Profit Week 2 leaderboard?
I noticed that PASSED_PARTICIPATION_THRESHOLD_ON indicates 0.0 (https://www.aicrowd.com/challenges/insurance-pricing-game/submissions/111795), though I’m scratching my head as to why it wouldn’t have made the cut given the underlying RMSE from the claims was in top 10 the the pricing was a slightly inflated version. Considering that a flat average baseline seems to make the cut, I’m a bit puzzled.
I’ve looked at your submissions to each leaderboard and you’re right the main difference is that the pricing was slightly inflated.
But as with any market, the competition will depend on what others are doing. I do have three comments:
Your prices might be too expensive / not selective enough. In this iteration of the leaderboard it seems that in every market there is someone that is undercutting your prices for every policy.
Keep an eye out for the incoming feedback. There will be some feedback coming your way at least for the first profit leaderboard. We are working to give you some dataset level feedback as well for both leaderboards that might help (e.g. your offered prices).
Flat rate baseline being included. I can see why this is concerning. But consider that the flat rate baseline is doing terribly (almost the largest loss), not to mention, that due to the randomised nature of the markets, only a small fraction of the time would you have been exposed to the effect of the baseline in the market. In the vast majority of markets this model would not play, in fewer would it play against any one particular player.
Having said that notice that @fredrlwo who was not participating in week 1, is now in the top position after some tweaks to their model. So non-participation only means that you might need some very small tweaks to your prices to get back in the game!
I hope that the feedback that is coming soon will allow you to study the performance you see and try again
I can confirm that we used exactly the same submissions that you entered for week 1 to compute the week 1 leaderboard. Similarly we use the week 2 submission choices for week 2 and so on. If you had not chosen one then we will have used the latest submission prior to Sat 10PM CET of that week.
Generally speaking the submission process for each week will be:
If you have not chosen a particular submission before Sat 10PM CET then we use the latest successful submission.
If you do choose a submission on the linked form then we will use that for the upcoming leaderboard.
Hi @alfarzan
Thanks for these additional insights.
Can I ask if you could include the Tweedie likelihood and the Gini index to the feedbacks ?
This is mainly by curiosity, to see how these metrics relate to the final profit.
(if it can help, I can provide python codes for these).
Thanks !
I can’t promise anything as the feedback for this week should be complete and ready in the next few hours, but could you please send me the code regardless if you have it ready?
I will discuss it with the team and we will see what we can do
Hi @alfarzan , today I got an email with some details of my week 1 results and I think it doesn’t match the leaderboard results. Could you clarify it? In email my average profit per contract is negative while on leaderboard the profit for week 1 is positive. Even if the email describes results before recalculation the difference between revenue and losses is different than my previous profit on leaderboard.
This is the mean value of the revenues you’ve made in each market that you have participated.
Average Loss
This is the mean value of the losses you’ve made in each market that you have participated.
Average profit-per-policy
First the profit-per-policy is computed in each individual market you participate in. This is the profit in that market divided by the number of policies you win.
The average profit-per-policy is then the mean value of this computation over all the markets that you have participated in.
Average loss-ratio
The loss ratio is the losses divided by the revenues in our markets.
This is computed in exactly the same way as the average profit-per-policy. We first compute all of your loss ratios independently in each of the markets that you have participated, and then we take a mean value of these computations.
Average market share
This is the mean value of the market-share in terms of the number of policies you have won. Note that this is not a revenue market-share, it is a policy market share.
So a market share of 0.50 means you won 50% of all policies, not that you won 50% of all premiums.
Total number of markets
This is the total number of markets that you have participated in.
Would it be possible to grant all of us access to the Market Feedback of the Baseline Mean Model? This would certainly help us further in our pricing strategy.
Also, I don’t seem to read any rules that prohibit multiple accounts by an individual. Those with multiple accounts surely can gain unfair advantage.
The baseline models will be excluded from markets from next week just because many participants are concerned about their presence.
The mean model is the only one that made it through in week 2 and I am attaching the feedback. Please note that your model is not likely to have been in many markets with the mean model due to our randomisation in relative terms.
Regarding the multiple accounts, thanks for noticing that! Indeed this is not allowed site-wide and the terms of use are being updated to reflect this fact. I will respond here once that is done and link you to it.
I should re-iterate that the baselines will be excluded from this week
 !
!