How are you doing?

Hey there!

This far into the competition, and having some time off, I want to initiate a discussion, so that this forum is more than just:

  • debugging issues
  • bugging @alfarzan about evaluation metrics/leaderboard … :smile:


… Are you overlooking it? :see_no_evil:

The first part of this competition is a relatively normal modeling challenge; tabular, good exposure, a few handfuls of variable.

And then there’s a 2nd portion that I believe most might overlook… the pricing strategy.

I know I am… …guilty! :robot:


Creating my own internal leaderboard :chart:

Having several models on hands, today I tried to actually look at pricing, instead of simply RMSEs.

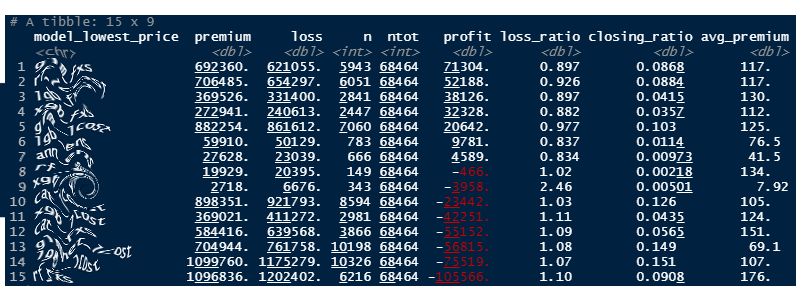
  • 15 models, with diverse algorithms,
  • 68.5k test policies,
  • lowest price wins.

Calculated profit, loss_ratio, closing_ratio and avg_premium.


Results :trophy:

First off, interesting to see how spreaded was the market share. (closing ratio).
There’s no single clear winner..

Also very interesting to see some models winning significantly lower avg_premiums (model #13) (on significant volume) . Tells me it’s larger risk pricing is not competitive at all.

But can I really take anything away from this? … this is a just sample, and limited data to create enough folds.
…ugh . :zap: randomness in insurance is challenging…


And you? :wave:

How are you feeling these days… Are you overlooking the pricing?
Or have you all been developing price optimization, simulating markets and competitor prices? :chart_with_upwards_trend: :chart_with_downwards_trend:


Side note:

I’m guilty of having spent way too much time on this project… :mantelpiece_clock:
I’m curious about others? Were you caught in more than you would’ve expected?

9 Likes

Wow, this is great. Thanks so much for sharing! Blurring the model names looks pretty cool. I think we can mostly guess what they are :slight_smile:, but I assume that’s your intent.

I totally agree that most teams probably focused way more on the loss accuracy model (my team is definitely guilty of this). We actually did something very similar to you this week, though with fewer models but we also tried sampling different portions of the training to run the profit simulations through. I agree that it’s still difficult to figure out what to do for a pricing strategy.

The thing is though, if this type of simulation is able to lead to some insights, then I think we should have seen more consistency in the weekly profit rankings. Since we haven’t, it makes me question if there really is a winnable pricing strategy? Whether the answer is yes or no, it’s super interesting.

What seems to be clear from the leaderboards is that RMSE isn’t as correlated to weekly profit as maybe most would have expected. Beyond that, I’m not sure if anyone is feeling confident about their pricing strategy…

I’ve also spent way too much time on this project… but it’s been a great learning experience.

2 Likes

Thanks for the insight! I feel bad scrolling down the forums and seeing everything is just a debugging post.

Yea so far our team has been completely overlooking the pricing aspect. Spending all our time on getting the rmse leaderboard higher and making our code easy to work with so we can run these experiments in future.

We haven’t even got to the stage of setting up these market competitions yet! It is definitely on our radar that we have to do it and figure out the best way to evaluate pricing strategies for the competition if we want to be successful

This is our 3rd week of it and we’ve been doing pretty poorly on the profit leaderboard… this is no surprise to me!

I’d love to see a plot of rmse vs avrg profit for each week after the competition.

2 Likes

So, since @simon_coulombe was so generous with his loss model, here’s the week 7 submission RMSE versus profit ranking plot :smiley: 
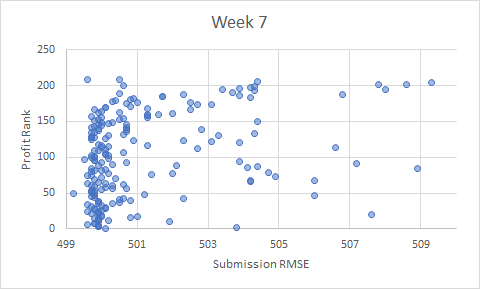
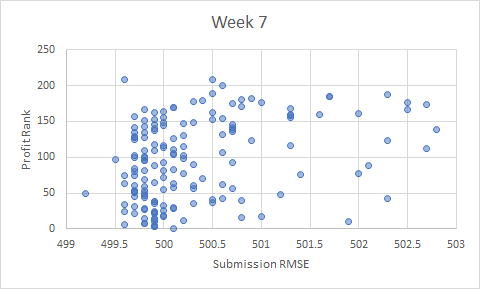
(the two charts are based on the same data, but the x-range has been adjusted):
image
image

I also scraped the submissions for the other weekly profit leaderboards. Here’s the CSV. Hoping someone does a cool analysis with it :slight_smile:.

4 Likes

Thanks for sharing the model comparison, it gives a good idea about how different approaches can give very different results even if they all appear to be giving reasonably good fit to the data. These are my current thoughts on the pricing part of the problem, for what they’re worth - it not exactly a strategy, but more of a set of considerations when designing a strategy:

  1. The need for a loading to your model output: if everyone submitted prices from their models without applying any loadings then assuming everyones models are producing estimates that are on average similar to the test data the winning price for any individual policy is likely to be lower the average.You are more likely to win policies where your model under estimates the cost (and so will make a loss) and you are less likely to win a policy where you model accurately predicts claims, or where it over estimates the cost, because some other person is likely to have a model that produces a lower estimate. A loading needs to be applied to your estimated cost of claims to allow for this, or losses are almost certain. The loading needs to be high enough to overcome ‘the winners curse’, but not so high that you end up with no policies.

  2. The loading should be different for different policies:
    Regardless of what model you use, the estimated level of claims on any policy is informed by the claims on similar policies and on examining how differences in policies lead to differences in claims. The more data you have on policies and their similarity or differences the better the model is likely to be at estimating. Any model is likley to perform worse in areas of the data where there are few other policies that are similar to the one you are trying to estimate. The range of estimates different models come up with is likely to be wider when there is less relevant data to base the estimate on, so the risk of winning a policy which is significantly underpriced is higher.

  3. Better claims models matter
    In the case of a market with two insurers where one insurer charges the same price for all risks and the second sets prices just on the average of past claims based on vehicle value, the winners curse will be more like to impact the first insurer more than the second. The first will win all the high value vehicle policies at a price which is too low, and won’t win any of the low value vehicles where is price is too high. The second insurer may be able to win the policies on lower value vehicles but won’t make much of a profit. The same logic applies when the models get more complicated. Having a better model lets you pick the better risks at a better prices

  4. Your competitors price matters
    Going back to the last example, the second insurer is losing out on potential profit by charging a price significantly below the first insurer for low value vehicles. Really they only need to charge a little less than their competitor to win the policy, anything lower than that reduces their profitability.

5)Randomness matters:
A small number of large claims account for a significant part of the total claims cost. If you have a cheaper price for these policies compared to others you will be more likely to have poor results. To some extent large claims are more likely to occur on some policies than others, but they still occur at random. If a loading is too high your portfolio will probably be too smal to absorb the cost of random large claims when they occur. Randomness can also work in your favour if you set a price which includes an allowance for large claims, but you end up with fewer large claims than expected.

A winning pricing strategy is likely one that is based on a good claims model that uses data the best way to form good estimates of losses, applies appropriate loadings to offset model deficiencies and the winners curse, and manages the random element well. There isn’t much detailed feedback on how your price compares to your competitors, so that part is probably the hardest part to manage. Getting the balance right on all of these factors is not easy.

The top position on the final leaderboard is probably going to be a bit random (particularly if there are some really big claims in the final data set), but the real prize is mainly what we learn along the way. I know I’ve learned alot with this challenge, so thanks to the organisers for all their efforts setting this up and running it.

6 Likes

only one simple comment from my side: wayyyyyyyyyyyyy too much time spent on this project :smiley: but indeed it was very didactical - in fact we are very happy about all the analysis/findings we did! now let’s see how eventually we will end up the competition, to see if all the hours spent can go to the bin or not :wink:

1 Like

I just joined. I am trying to brush up on R and am at the moment analysing data in Excel. Still need to build GLM,

4 Likes

So also need to fit models to data - decide on final model and then add it to the data. then decide on a premium per policy with some additional loading.

3 Likes

Hooray. Got a frequency model, a severity model and a premium model fitted to training data. I wanted to go multiperil etc but not enough R knowledge and time Now I need to work out how much time I have to improve them and how to submit them.
Can I beat the closing date?
I need to make sense of the options I have.

1 Like

Interesting! When you say multi peril , do you mean a different model for each level of coverage? (min, med1, med2, max).

I briefly thought about doing so but gave up. Didn’t have enough time… Prefered venturing into different algorithms.
 

I did do various frequency, severity and pure premium models on my end. Which one did you find worked better? I think the former performed better.


I didn’t have any R knowledge as well. I spent countless hours reading, reading, reading. My browser history is filled with stackoverflow. I wanted to share my whole learning process but didn’t find the time to write it down. Hopefully I will.


Your username and syntax hints that you might be French speaking. (I am).
I’m curious, What’s your background? Are working at one of the many insurance companies based in Quebec?

1 Like

Hello.
Not French but still trying to learn it. I am in UK and gave up this work a while ago
I used to build GLMs with software which did all the hard work and with SAS which was pretty good too back in the day.
Minimal data checks due to time shortage.
Let me explain. If my R was good and I had the time I was going to build 4 categories of models: Claims up to say 1000, 1000 to 3,000, 3,000 to 10,000 and over 10,000 say as I felt the data although without claim type details such details were referred to. The frequency models are easier than the average cost. I had come up with an expense or contingency loading method too.
However I am struggling to build the average cost model as I was hoping to not have to split the data by using weights of 0 where claim is zero and 1 otherwise.

It would be so much easier to create the datasets in Excel and then export as .csv for R but I think that is against the rules.

Finally in a perfect market, all it requires is one person to build the perfect claim model and be too greedy for others to profit.

1 Like