How are you doing? (Part 2)

Hey there!

Last week, I posted how I felt the pricing strategy was probably overlooked by participants, mostly seeking the best RMSE. (I was!).

I spent the week venturing deeper and deeper in the pricing strategy…

Chaising tail :dog2:

def. To be very busy or working very hard at some task but accomplishing little or nothing as a result; to be engaged in some fruitless or futile task or endeavor. (1)

^^ This is what it felt like, throughout the whole week.

 
You can try all your best, apply various assumptions, and run thousands of simulation.
The missing element is immediate validation, which unfortunately only comes once a week.
I wish there was a better way! :thinking:


Hundred hours of CPU time… :desktop_computer: :desktop_computer: :desktop_computer:

  • 11 models (A to L) , all different algorithms.
  • All were deemed reasonable fit, in terms of RMSE.
  • Fitted 8 different times (a new seed each time S_ ).
  • Keeping a different 30% holdout each time.


Profit rank :moneybag:

For each fit, models are competition, and profit rank returned.

profit_rank

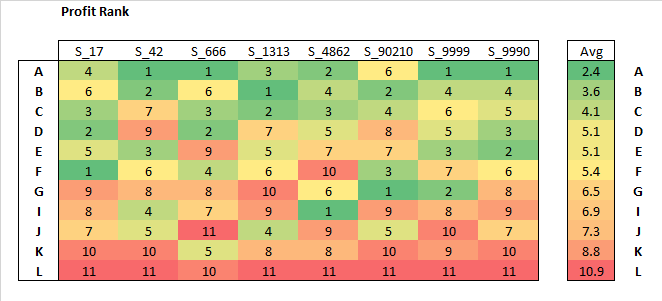
On a profit ranking, as you can see, some models do perform better on average than others.
However, no unilateral better model.
Selecting an average of model A, B, C seems reasonable.

Model L systematically performs the worst.
Safe to say I would never use that model, … right?


Mind blown :exploding_head:

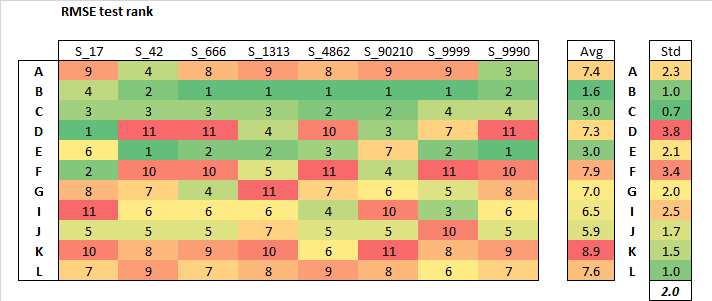
When I put together a similar chart, with a RMSE rank on the holdout test…

EDIT :: CHART WAS IN ERROR, PLEASE SEE MY REPLY BELOW


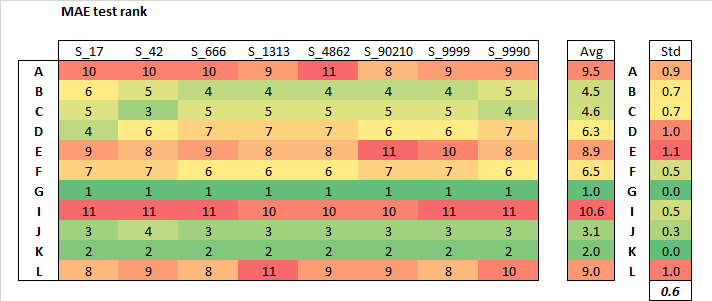
And the same chart, but on MAE…

EDIT :: CHART WAS IN ERROR, PLEASE SEE MY REPLY BELOW


Siren song :wavy_dash:

an alluring appeal, one that is deceptive

^ That’s a popular saying in french.
Those two metrics graph lead me to think one can be greatly misled by selecting a model based on RMSE and or MAE.


Coincidently, @lolatu2 did a post recently, questioning if RMSE was an appropriate metric.


And you? :wave:

  • What do you all think of this?
  • Have you been selecting your best model, based solely on a specific metric? If so, which one?
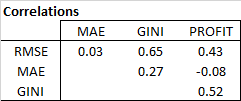
  • Ideally, one would like a metric that is correlated with profit ranking.
  • Do you have a metric suggestion that you want me to try?
10 Likes

What is the average loss ratio if all models charge their predicted claim?
(guesstimating a value for winner’s curse)

edit: I see you’re using seed #42. This is best practice.

for my part, I reuploaded my Christmas submission with a slightly modified pricing margin :slight_smile:
There’s some ideas I’ve been meaning to implement, but that won’t happen for this edition of the challenge.

4 Likes

Excellent post! I’d suggest gini coefficient as an alternative measure - I’ve put a reasonable amount of weight on it personally, and know that it’s commonly used across the insurance industry.

1 Like

Are you applying any loadings to your models? If you apply a loading to your worst model are there any situations where it produces higher profits than your best model with no loadings applied?

1 Like

At least with the chasing tail example, it’s just that nothing gets done. I’m achieving more and more unprofitability :rofl:.

2 Likes

Just chipping in on this one* (btw awesome post once again! :clap:)

As @Calico mentions I think the profit loading and the pricing strategy play quite a large part here.

Correlated claim estimators happen :curly_loop:

Basically, if we fit a whole bunch of models out of the box, my guess is we will have a decent amount of correlation between each model predictions. My intuition is that this is actually the case in your example since the MAE and RMSE rankings are quite sensitive to the initial seed. There are two types of correlation here:

  1. Correlation because they’re all guessing who is risky and who is not. :white_check_mark:
  2. Correlation because they are all making the same mistakes :x:

Correlated estimators :arrow_right: margin sensitivity

In the extreme, if you have two kitchen-sink Logistic models and the margin on one is 10% and the other is 15%, you can see that the latter will be crushed in every market with the former. So the profit loading matters a lot here. Note that I don’t think this happens a lot in our markets (+ we have randomisation), most people seem to have very bespoke models! But I think it is happening in the analysis here where each model will have a natural variance which becomes their effective “random” margin (e.g. GLM has more variance than a mean model).

Solution is probably to be more “unique” :trophy:

This effect is less and less pronounced the more unique and bespoke the pricing strategy and claim estimators are. That way you are essentially “carving out” a piece of the market for yourself (reducing type (2) correlations from above) and competing less with others. :dollar:

A note on claim estimation Vs profit performance :thinking:

I would be curious @michael_bordeleau to see if this apparent lack of relationship between claim estimation and profit would be sustained if you control a bit for the claim estimation of the models. So in the market putting in models with better and better claim estimators in a wide range and then see. My guess is that right now we don’t see that because they’re all pretty good (within a tolerance)!

*None of this is based on actually analysing any markets, just some thoughts.

5 Likes

I AM FINALLY PROFITABLE!!! :partying_face: :partying_face:

All that work for $465 of profit… I’ll take it.

3 Likes

Thank you all for the comments!

@Calico Yes I was applying a loading, however same method for all models… simply multiplying by 1.15.

@simon_coulombe I’ll keep working on this, but so far, I’m seeing an average loss ratio of 120% when there’s absolutely no loading. Probably sensitive to the number of models in compete? To be continued.

@alfarzan First time I’m hearing this kitchen-sink nomenclature. Funny. Will look into your suggestion. Didn’t think of creating bad model on purpose.

@tom_snowdon Thanks for the suggestion, and results are below…


Disclosure

To produce the charts earlier, I left R and went into Excel…
…and I got fooled by Excel’s =rank() function…
Did you know Microsoft decided on returning a decreasing order by default?!. :roll_eyes:

Now I know, and so do you.
Some of the charts were (very) wrong, sorry for that.


Profit (same as before)
profit_rank
 

RMSE, MAE revisited, and GINI :bar_chart:

Added standard-deviation row-wise, and the average of the stds.

Gini seems much more sensitive to the seed than the other two metrics.
@tom_snowdon what’s your take on that?
 

Correlations

correlation_test


Some Thoughts

  • With the fixed chart, Model L is safe from my relentless bashing.
    It’s just an overall poor model.

  • Still looking for a metric that could be better correlated with profit. Open to suggestions!

  • The previous erroneous chart did influence my decision for this week leaderboard.
    Scored 99th position lol.
    Thanks Microsoft.

6 Likes

Very interesting!

Nothing immediately comes to mind regarding the Gini volatility, but it’s interesting that it has the best correlation with profit rank.

The stability of the MAE results are interesting too. It’s not worth drilling into … but if you want some ideas about what to try, I’d suggest rebasing your predictions on the training samples (i.e. models always break even on train), this won’t affect Gini, but might shake up the Mae (and maybe rmse) ranks a bit.

1 Like

I’d just say that between RMSE and MAE, it’s a tricky one.

In our initial discussions there were pros and cons for both. On the one side RMSE disproportionately penalises the large claims (arguable if you want this in insurance since they’re probably random) but it is minimised by the (conditional) mean. On the flipside, MAE does not penalise the large claims too much (great), while it’s minimised by the (conditional) median.

If I grossly oversimplify, if you always guessed the median claim amount, in your training data, you’d minimise the MAE and if you guessed the (conditional) mean claim amount you’d minimise the RMSE.

This doesn’t matter unless your dataset has lots of big outliers (like here), in that case what you minimise for starts to look very different.

So then the question is should you be shooting for the mean or the median?

Well, we want to make money overall, so we should shoot for the mean (or that was the thinking). Specially when we see that the dataset is so imbalanced. Hence RMSE.

There are complications, because all the above must hold for the policies you win not just the whole data and that really skews the distributions. But a priori, this was the thinking.

Having said that, the cool analysis here by @michael_bordeleau is food for thought for the future and other ways of looking at it :thinking:

2 Likes