Thanks @Calico that’s really nice 
I wanted to dig into this topic a bit for years; this forum gave me the opportunity to do so 
So I tried to model what the optimal strategy would be and how it changes based on the uncertainty in the model.
I used a very simplistic framework to try to keep things clear.
I supposed :
- there is an (unknown) risk attached to a policy, called r (say, r=100). The insurer has an estimate of this risk, following a gaussian around it : \hat r=Normal(r, \sigma) .
- there is a known demand function depending on the offered premium \pi : d(\pi) = logit(a+b \times ln(\pi))
In this situation, the first conclusions can be derived :
- for every price \pi a real profit B(\pi) can be computed (but it is unknown to the insurer as the real risk r is unknown : B(\pi)=d(\pi) \times (\pi - r) ).
- an approximation of this real profit can be computed : \hat B(\pi)=d(\pi) \times (\pi - \hat r) ; interestingly it is an unbiased estimate (but using it for price-optimization purpose very quickly lead to funny bias ; I won’t focus on this here)
- it is quickly clear that most of the computations we can do will not lead to a closed formula ; the reason for that is because the real optimum (solving \dfrac{dB(\pi)} {d\pi}=0 ) does not lead to an explicit solution, I think. So all the results here will be based on simulations.
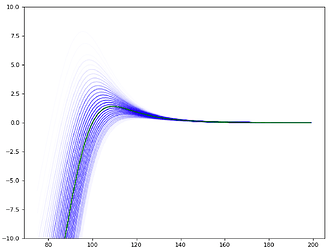
For instance in the graph below (x axis : premium \pi ; y axis : expected real profit B(\pi) - in green - or estimated profit \hat B(\pi) in blue, for different values of \hat r) provides an view of the truth and the estimated truth according to the model.
The question raised by @simon_coulombe is : given an estimated risk \hat r and a known variance in this estimate \sigma, what is the best flat-margin (called m) to apply, in order to maximize the expected value of the real profit : m^*=argmax_m E(B(\hat r \times (1+m))) ?
The intuition we all shared is that it should increase with \sigma. @Calico suggested it should be linear.
As there is no obvious formula answering this question, I ran simulations, taking an example of demand function (a=64, b=-14), a real r (100), and varying \sigma, running 1000 simulations with different \hat r every time.
For every value of sigma, all values of the margin m were tested and the one driving the highest profits B(\hat r \times (1+m)) on average over the 1000 simulations of \hat r was found.
The optimal margin m increases as expected when \sigma increases, as one would expect :
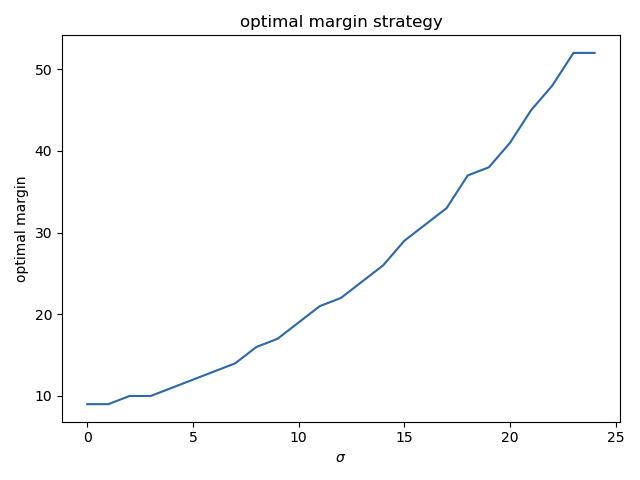
(the values are rounded and there is some noise around \sigma = 20 but it looks more or less linear, indeed).
The profit goes this way :
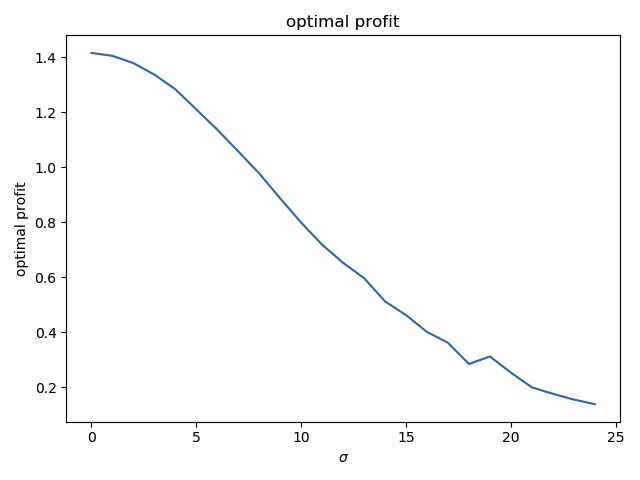
(if the real risk r is exactly known - \sigma = 0 -, a profit of 1.42 can be obtained. If \sigma goes to infinitly large values, the profits tends toward zero.)
This simple test raises a lot of questions that I would like to investigate more seriously in the future :
- is the optimal margin really linearly increasing with \sigma ?
- if I use a noise that is not gaussian, what will be the relation ? Maybe there is a distribution of the errors that helps the maths ?
- in this toy example, the demand function was supposed to be known ; what happens if it also contains errors ?
- how can I estimate the model errors (it is very hard for the risk models, but probably much harder for the demand and price-sensitivity models !!)
- strategies optimizing naively the estimated profits \hat B(\pi) built from the estimated risk \hat r are known to be a bad, leading to over-estimated profits and suboptimal pricings ; can a simple correction factor be applied, and how does it relate to \sigma ?
So to summarized, this test kind of confirms the intuition is more or less true, but opens many more questions !! If anyones has some papers on this topic, I would be really happy to get more serious insights !
