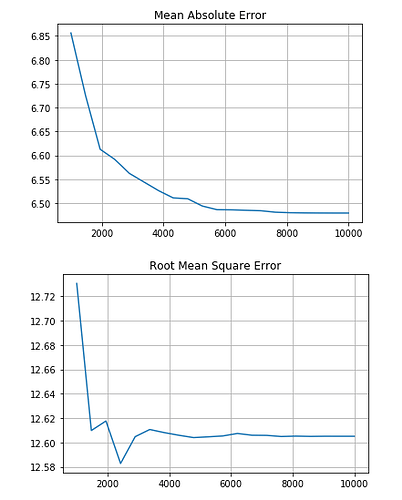
I used decision tree regression for this challenge, and in a decision tree, the number of nodes decide how overfitting or undercutting the model is. And I wanted to chose a number of nodes in which the number of nodes is minimum, so I plotted the error vs the number of nodes using matplotlib:
I followed Mean Absolute Error to chose the number of nodes because it was the judging criteria as well (but the saturation more or less happens in Root Mean Square error around the same point) (P.S. I feel the secondary score might actually be RMS error)
It was my first time with anything to do with Machine Learning, so please correct me if I’ve used any wrong terminology, etc. Also please suggest if you have ways in which I can improve my model, would love to learn.
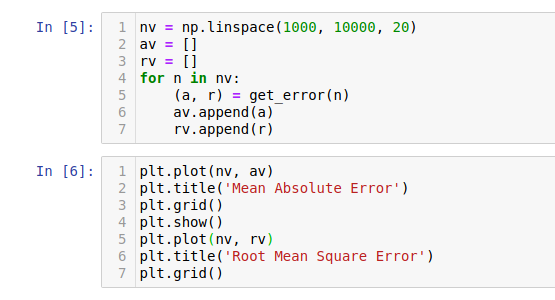
By the way, this is what I actually plotted:

I used 1000-10000 range initially because with 80 features, thousands of branchings in a Decision Tree are expected. The get_error() function is simply returning me the mean absolute error and the root mean squared error.
Now I changed my range of ‘n’ multiple times to get different graphs, and then I chose the one I thought was the best. (After a point there is not much change in the error, you can say it nearly saturates). I followed Mean Absolute Error to chose the number of nodes because it was the judging criteria as well (but the saturation more or less happens in Root Mean Square error around the same point) (P.S. I feel the secondary score might actually be RMS error)
Hi
Yes secondary score for the challenge is Root Mean Square error.
1 Like
The RMSE is an indication of the noise levels in the scale of standard deviations. When we fit linear regression model and if in case we need to use dummy variable for observed but unpredictable spike( this is know as episodic events) then there could be possibility that model is over fit in forecast periods. It means that instead of switching off episodic events, our model also captured the error terms ( this is the one of the difficult task to differentiate random error and episodic events). So in forecast, if we want to check the accuracy of the model and avoid over fit and any episodic event in future; we can square root the MSE value and due to square root, model avoids outliers (robust against extreme values) in the forecast period. As we cannot model spike in the forecast period.

