Hi @alfarzan
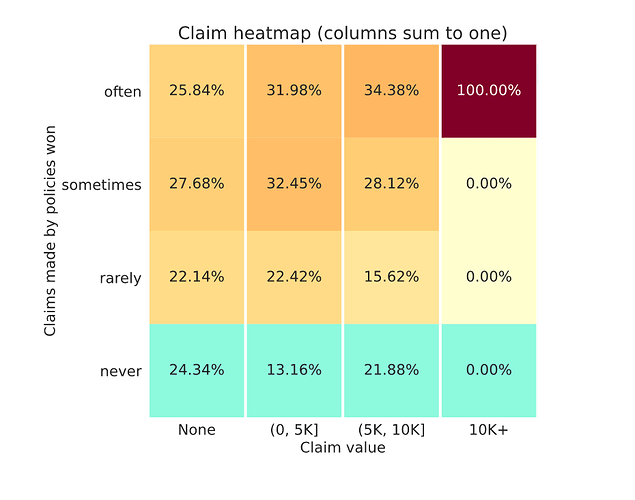
Could it be that the values in the new heatmap (claim size vs claim made by policy won) changed from Sunday?  we are sure we saw other values on Sunday when the leaderboard was published …
Yes!
We noticed a small error in the way the heatmaps were being computed and so had to push a sneaky update to them all last night. They are all now correct 
Good spot… but I have to say I don’t like what the new one is telling me!
A potential silver lining is that… maybe in my model I have found a way of identifying all the policies with large claims… now all I need to do is stop writing them! 
Mine were split 50:50 between ‘often’ and ‘sometimes’ so there may have only been 2 or 4 large claims. Interesting to know if anyone had a lower resolution than 50% in that column.
Also… no team had a total profit larger than a single claim of max size, so there is obviously a lot of luck involved in the pricing leaderboard as well as the RMSE leaderboard.
Agree - even though you got eventually a 15% market share…it is not only luck, or at least you had a decent portfolio size to manage volatility…
… we, on the contrary, got only 2% of market share … and to arrive 7th place was quite lucky to be fair 
