Hmm ok we’ll look into this and see the scale of the issue. If many people had this issue then we will definitely take action, and if any model fails because of this we’ll get in touch 
2 Likes
Well, as we saw from the weekly profit leaderboards, a more accurate model might not be that helpful anyways  . Since year 5 is completely new data, I also wondered if the prior year features would correctly extrapolate/generalize. I guess I probably wouldn’t change my submission at this point regardless. Looking forward to seeing the results!
It’s a shame the confusion. In my case, from the first moment I understood that the predictions with access to past information were only for the RMSE classification. In my opinion it is very clear in the instructions that the final leaderboard is only with information from year 5 and that it should be a model that works policy by policy, without past information.
In fact, I did a similar approach for other participants by saving some of the past information in my model. It would seem so unfair to me that the participants who have been confused do not participate after the work carried out as if they had advantages over those who have understood the methodology of the final classification.
I would propose that confused participants be allowed to adapt their model to receive only information from year 5. But they should not be able to change the price, or create new variables… Just make the minimum changes to be able to participate without any additional benefits.
Finally, I want to add that this is the best competition I have ever participated in. Congratulations to the organizers for the great work.
2 Likes
I decided to sell “so expensive” because whenever I lowered the price my profit was negative. That made me feel sad because I think our solutions (markets) are not social optimum.
Probably my quantitative models are too conservative so there not much difference (compared to other modeling methods) between people who made at least a claim and other people.
2 Likes
Yes, I was expecting the same format.
I see what lolatu2 is trying to say, but I don’t buy the arguement that inclduding year1-4 rows is advantageous to michael, myself or others in our position - even if there is only year 5 data, prior year information can still be passed into your model, you just chose not to. I could have created a dataframe which contained all prior year features as part of my “model”, I just chose not to handle all prior year features this way because that would have meant refactoring my code (and it hadn’t even occured to me that this might be necessary, since the competition so far always gave access to prior years for all leaderboards).
2 Likes
Ok, thanks.
I tried my best to have a fool proof model so that it doesn’t crash. So I doubt it will crash…
Ultimately, the fix I would need is just to retrain the model without the few features developed on past data, such as the movement of NCD through time.
And I agree with RHG, we should not be able to change the price nor create any new variables.
(Easy to validate as staff has all our codes)
1 Like
I think the other intent from the admin’s side with the final test data is to simulate “new” business where we don’t have access to the prior year data.
The final test dataset, where the final evaluation takes place, includes 100K policies for the 5th year (100K rows). To simulate a real insurance company, your training data will contain the history for some of these policies, while others will be entirely new to you.
1 Like
Hmmm
I really don’t want Ali to be stuck having to verify thousand of lines of code to make sure nobody sneaked some new variables in it after we discussed our approaches in this very forum.
I think the best approach is to let you sink.
Just kidding. Feeding year 1-4 of the training data along with year 5 of the whole dataset and calling it a day seems the fairest approach. Anyone who needed that data could have just saved the whole training set in their zip file submission anyway.
I’ll take my bribe in bitcoin.
5 Likes
Exactly, many people will have already saved this information in their model (through an extra lookup table), so it makes no difference to them, only to those of us who were expecting the information to process those features “on the fly”.
Yea, I think that makes sense. So just run the test set through including the ~240K training data that we got, then filter the predictions on Year 5. That way, there is still the 40% policies that your models wouldn’t get prior year history for, which I think is in line with the original final evaluation intent. I just wouldn’t feed Years 1-4 through for all the policies, since that would actually cause others who understood the evaluation correctly to probably want to change their models. (I’ll take bitcoin too.)
4 Likes
Oh yeah, just to be clear, the only sensible solution I see regarding the 5 year history issue would be to include the training data when a model is being run. Though as @lolatu2 mentions the 5 year history would only exist for the training data.
Also, when code fails we won’t be sending your models back to be corrected, we will work with you to debug and fix any issue so that we don’t have to do this manual code inspection in-depth afterwards. Otherwise I will have to plan for a few more years at Imperial 
5 Likes
That’s clever. Didn’t think about that. I could have used the prior version of my model for the ~40K without history and my new model including prior claims for the ~60K with history.
Instead, I did bundle the ~40K new one with the no claim bunch. (which is not so bad because for year 1 everybody is assumed to be without a prior claim).
Anyway, fingers crossed 
1 Like
I agree, otherwise I’d like to have access to that data as well haha.
1 Like
That’s exactly what I did. And I thought I had said too much here, about busting the server memory trying to handle all the models 
Lots of really clever ideas there - good job!
We discussed this offline, might as well add my comments here
This is the part I’m really wondering about. My understanding is that you calculated a frequency for each city, then “pulled” toward the global average. Cities with less exposure would be pulled more than cities with big exposure. What’s the formula for that?
I was thinking about using a “poor man’s bayesian” approach. Basically I would calculate a frequency for all the cities, but for each city I would add (say) 50 years of exposure and the number of claims I would get at the global market frequency. If the global frequency is 0.10, then I would add 50 years of exposure and 509 * 0.1 = 5 claims to every city. A small city with 4 years of exposure and 1 claim would have a “bayesian” frequency of 1+5 claims over4+ 50 years, so 0.11 , while a larger city with 400 years of exposure and 100 claims would have a “bayesian” frequency of 100+5 claims over 400+50 years, so 0.233, aymptotically trending towards 0.25.
Oh! I just had another idea. I’ve been looking for a way to incorporate that my loss function is asymetric: I don’t mind overcharging ( I just lose a sale), but I really don’t want to undercharge and be the victim of adverse selection because the only person from that city in my portfolio never made a claim. In other words, I really want to charge you more if you are in a “risky neighbourhood with small exposure” but I dont necessarily want to give you a rebate if you are in a “safe neighbourhood with a small exposure”.
One way to do this might be to have a larger offset when I your frequency is lower than the market average. Like if you are over the average frequency my offset is 5 claims and 50 years (like above), but if you are under the average my offset will be 10 claims and 100 years, so it’s easier to bring my price down.
2 Likes
Here is the modeling approach I took. I had tested several models but ended up with QDA and Linear Regeression.
-
Use binary logistic regression model to predict the likelihood of a claim and a linear regression to predict the severity.
-
Resample data for logistic regression: I oversampled policies with claims and under-sampled policies without claims.
-
Resample data for linear regression: We could use the same resampled data from #2 above, but I prefer to resample again since it has been proven to have a better performance with different samples/subsets of the same data. There are 2 ways to resample for linear regression:
a) Only use data where “claim amount” > 0. This is the most common approach but it overstates the amounts as every new policy will have a “claim amount”.
b) Use policies with “claim amount” > 0 but add some polices with “claim amount” = 0. This is my preferred approach but there will be instances when the “predicted claim amount” will be less than 0. It is not possible to have claim amount less than 0 so will need to be adjusted.
-
Determine the threshold to be used for the predicted probabilities and predicted severity from the 2 models. I look at the distribution of the test data to determine the threshold.
-
Predict claim amount: This takes the data from #4. What we are looking for is to have the income that is close to losses (income = plus/minus 10% of the losses).
-
Predict premium: This is usually a trial and error for the first few weeks but we should be able to come up with a good figure based on our market share and profit/losses. I started with 3* claims + (some constant) and had 25% market share but more large claims. In the following week, I increased the premium to 4* claims which reduced the market share and large claims that resulted in higher net profits.
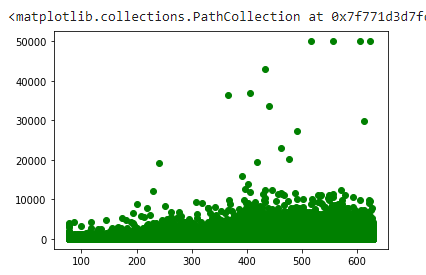
My goal was to write the polices in middle. Not the cheap ones with no claims or the expensive ones with lots of larger claims. This is my model on training data. X is price and Y is claim amount.
2 Likes
if the overall average was .11 and the city had .2 but only 200 observations but I require 400 observations to fully trust it, I’d set Z as sqrt(200/400) and make the weighted average as Z * .2 + (1 - Z) * .11, then cluster based on the weighted average. I wasn’t very scientific with selecting the requirements to fully trust the number but I did try varying it and checking what values resulted in clusters that improved CV fit.
2 Likes
that makes sense - thanks!
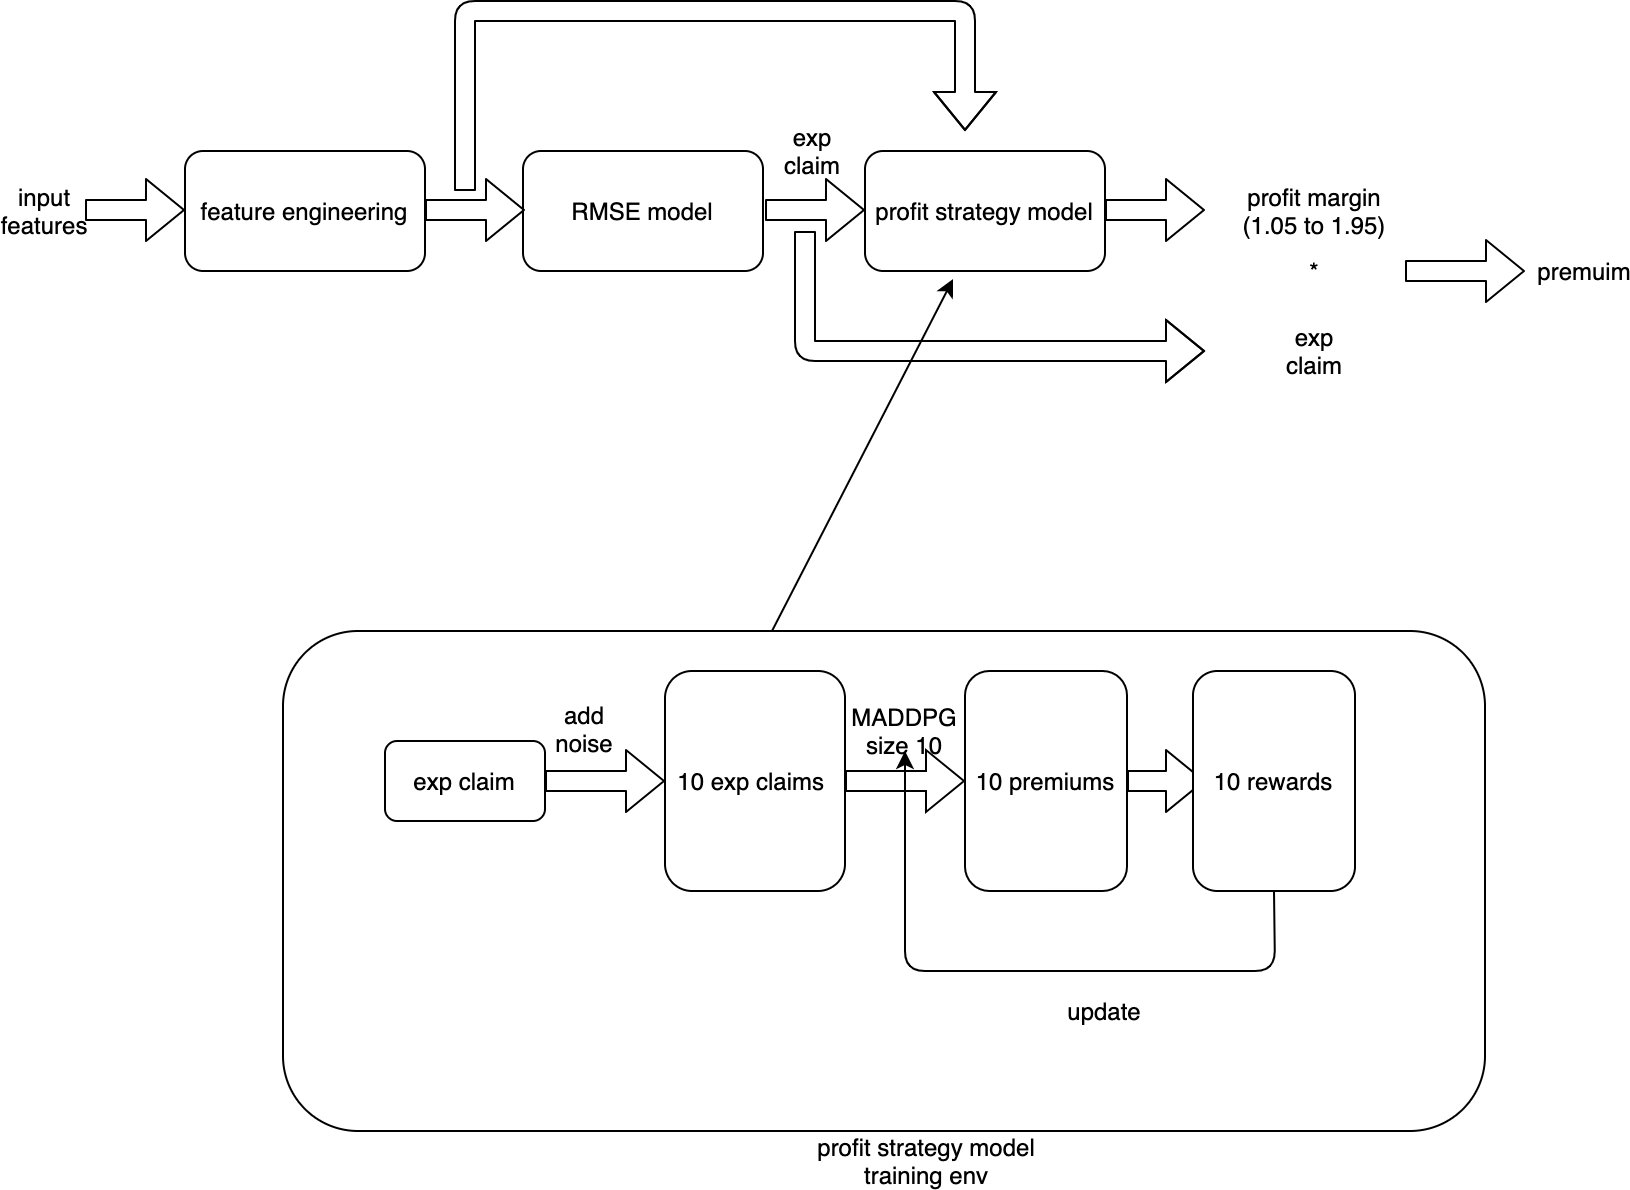
HI we used deep reinforcement learning(MADDPG @openAI 2018) to simulate the market environment and try to get a best strategy in a very unstable market. This is our brief summary. Here we focus on the profit strategy part since we find claim prediction is a high-variance problem(we add gaussian noise~N(0,15) and the RMSE almost does not changed, see 1.3).
1. analysing part
1.1 market summary analysing
| leaderboard average profit per invoice | our average profit per invoice | expected factor(1+profit margin) of market | expected money of RMSE model in market | |
|---|---|---|---|---|
| week9 | N(-4,10) | -1.5 | N(1.25,0.25) | N(115,25) |
| week10(predicted) | N(-1.5,9) | N(1.5,0.25) | N(115,25) |
leaderboard average profit per invoice is calculated from the leaderboard(see appendix), and expected factor(1+profit margin) of market and expected money of RMSE model in market is calculated from the market simulation experiment(this is a analysing in week9 and in week10 the average market profit is far more different than that we predicted in week9 haha)
the factor(1+profit margin) of all 10 agents in RL model after training obeys distribution~N(1.8,0.26), so i think the 80% profit margin will probably be a Nash equilibrium in this market simulation.
1.2 the relationship between our profit margin and average profit margin of market
something wrong here, I cannot upload table…but we find the best profit margin=market average profit margin-0.3(if market average profit margin is larger than 0.3)
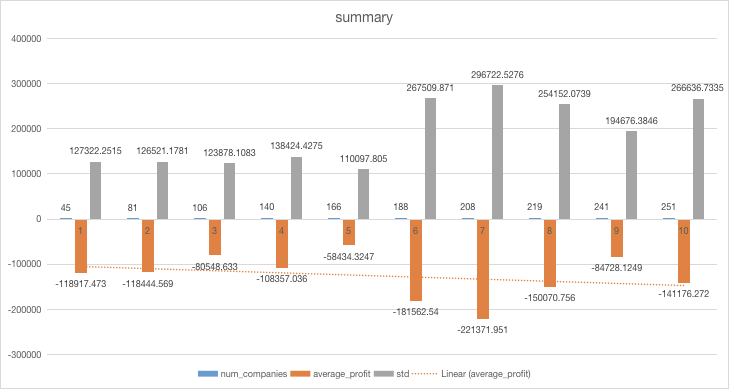
here to test the RL model performance we put the best one(choosed from 10, and we call it king model) in the simulated market and try to use any methods(like changing the profit margin of other competitors) to attack this king model and finally we find this king model can make sure to profit(at least dont loose money) in any environment with a average profit of 1.15 per invoice in hundreds of experiments. But we know the real market/compitetion is much more complex and competitive than our simulated market and most likely our profit depends on the profit strategies of other 9 companies(you cannot expect too much in a very bad market) so we dont expect too much.
1.3 why it is a high variance problem
here we add a gaussian noise with different std to test how random noise affects the result.
| noise std | validation RMSE |
|---|---|
| 0 | 827.74 |
| 15 | 827.76 |
| 20 | 828.1 |
| 25 | 828.15 |
so we think the claim prediction problem is a high variance problem as shown in the form.
2. inference pipeline
reference:
here i think the better way is using 10 different models to simulate the market environment as @michael_bordeleau but that would be much more complex so we did not do that.
appendix: leaderboard record
this thread in a picture

8 Likes