📝 Explained by the Community | Win 4 x DJI Mavic Drones

NEED EXTRA FEATURES? DIFFERENT APPROACH? Try Seismic Attributes!

Hello All, I am Leo. A simple geophysicist.

I wrote a little colab notebook on how to get new features using seismic attributes here.
Hope this will give you some extra data or even insight.
I will update more methods later.
Tell me if there are some errors.
Feedback and suggestion are always welcome!

#explainer

9 Likes

Hi Everyone :wave:

I have made a complete colab notebook from Data Exploration to Submitting Predictions. Here are some of the glimpse of the image visualization section!

And this 3D Plot!

Tables of Content -

  1. Setting our Workspace :briefcase:

  2. Data Exploration :face_with_monocle:

  3. Image Preprocessing Techniqes :broom:

  4. Creating our Dataset :hammer:

  5. Creating our Model :factory:

  6. Training the Model :steam_locomotive:

  7. Evaluating the model :test_tube:

  8. Testing on test Data :100:

  9. Generate More Data + Some tips & tricks :bulb:

The main libraries covered in this notebook is —

  • Tensorflow 2.0 & Keras
  • Plotly
  • cv2
    and much more…

The model that i am using is UNet, pretty much standard in image segmentation. More is in the colab notebook!

I hope the colab notebook will help you get started in this competition or learning something new :slightly_smiling_face:. If the notebook did help you, make sure to like the post. lol.

https://colab.research.google.com/drive/1t1hF_Vs4xIyLGMw_B9l1G6qzLBxLB5eG?usp=sharing

More things will be added soon!

By

7 Likes

A note or two about visualizing the data. If you notice, the observations are +/- 2000 (roughly). From a domain standpoint, the polarity matters. If you want to visualize the data, a better color map would be red as maximum positive, blue as maximum negative, white as zero, and interpolated in HSV space in between.

1 Like

Hi everyone!

I am Sergey, and I am a machine learning researcher in Gazpromneft, a Russian Oil&Gas company. I am working in the field of seismic exploration for some time now, and this hackathon is a perfect chance to showcase our skills to the rest of the world. Nevertheless, it is our very first time working with such type of structures on seismic data, so it is as new to us as to any other ML practitioners.

In this post, I will try to cover everything that I’ve done so far to produce submissions for this contest: from data exploration to generating predictions, with descriptions of pretty much every line of code. Also, as I had enough time for testing various approaches to work with seismic data, I will share them as well: libraries and tricks to use for geological analysis.

Currently, I use our own servers to run my experiments on; in the next few days, I will gradually transfer everything to COLAB to share the progress. That can take some time, so be sure to like this post and check it for updates!

0. seismiQB

To solve various tasks of seismic interpretation, we’ve developed an open-sourced Python framework seismiQB. It is capable of:

  • Working with seismic cubes at any stage of processing: pre-stack, post-stack, and 2d data. It may not be the most flashy thing from the standpoint of this contest, but allows us to conveniently work with any data we are provided with. Not only that, but our custom format of data storage can access data up to 30 times faster than regular SEG-Y can.
    It is designed to work with 100+ GB cubes, so may not be that necessary for the needs of this competition where it is easier to load everything into memory.
  • Creating pipelines of data generation. Apply augmentations on the fly with a chosen parallelism engine: for example, if you have code that transforms one image from your batch, we provide a method of applying them in parallel to every image in the batch via multithreading, multiparallel or async.
  • Configuring sophisticated neural networks with just a few lines of code. We’ve written our custom wrappers for TensorFlow and PyTorch, which allow us to use short configs to define even the most complex architectures. Our model zoo has a huge number of pre-implemented architectures, ranging from plain old UNet to the DeepLab v3+ with all the modern bells and whistles. If you don’t like any of them, it is easy to build your own model from pre-defined blocks like ResNet block, ASPP, Xception block, etc.
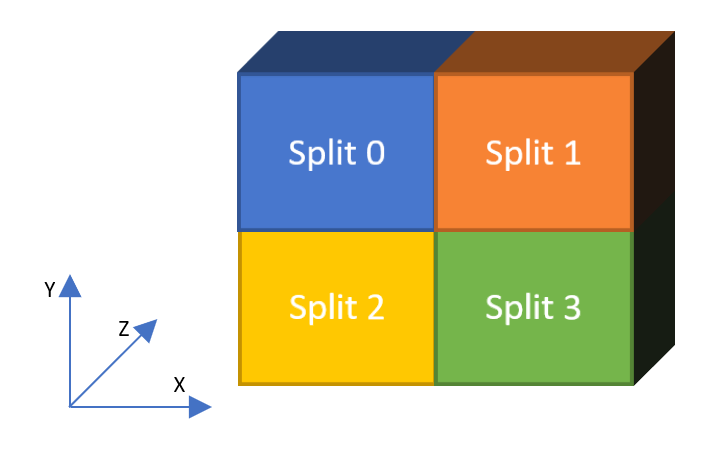
  • Training on arbitrary 3D crops, sampled from the cube according to the desired distribution. We can work with any shapes and have rich tools to cut the data from cubes and merge individual crops back together: that allows us to make overlapping predictions to improve the overall quality of our models.
  • Exploring hyperparameter space by running a number of experiments simultaneously. With all the wealth of parameters that is presented by our framework, we need to make a lot of experiments to narrow the exact architecture down. To this end, we have a special module, that runs them in separate processes, while keeping a detailed log of each of them.
  • Profiling of pretty much everything. If you do something – you can time it and check the memory consumption. As we write production-quality code that is used by our geologists on daily basis, we optimize everything to the nth degree. Our tools enable us to do so.

Our code has a lot of documentation inside, but if you have any questions about it, be sure to contact us! We also have dedicated libraries for seismic processing and petrophysics.

As I already said, we have never worked with facies like in this challenge previously: the tasks that we tackled so far are:

  • Horizon picking
  • Horizon extension and enhancement
  • Estuaries detection
  • Faults extraction
  • Reef outlining
    For most of them, we have openly available notebooks that demonstrate in great detail, how to solve the problem. We are advocates of a rigorous approach to our researches, so each of them follows our company-wide standard. Be sure to check them out!

In this contest, unlike any of our previous affairs, we need to do cube-to-cube prediction: to this end, I had to implement some new primitives, but that relates mostly to data loading. From the moment we have images and segmentation masks, it is business as usual.

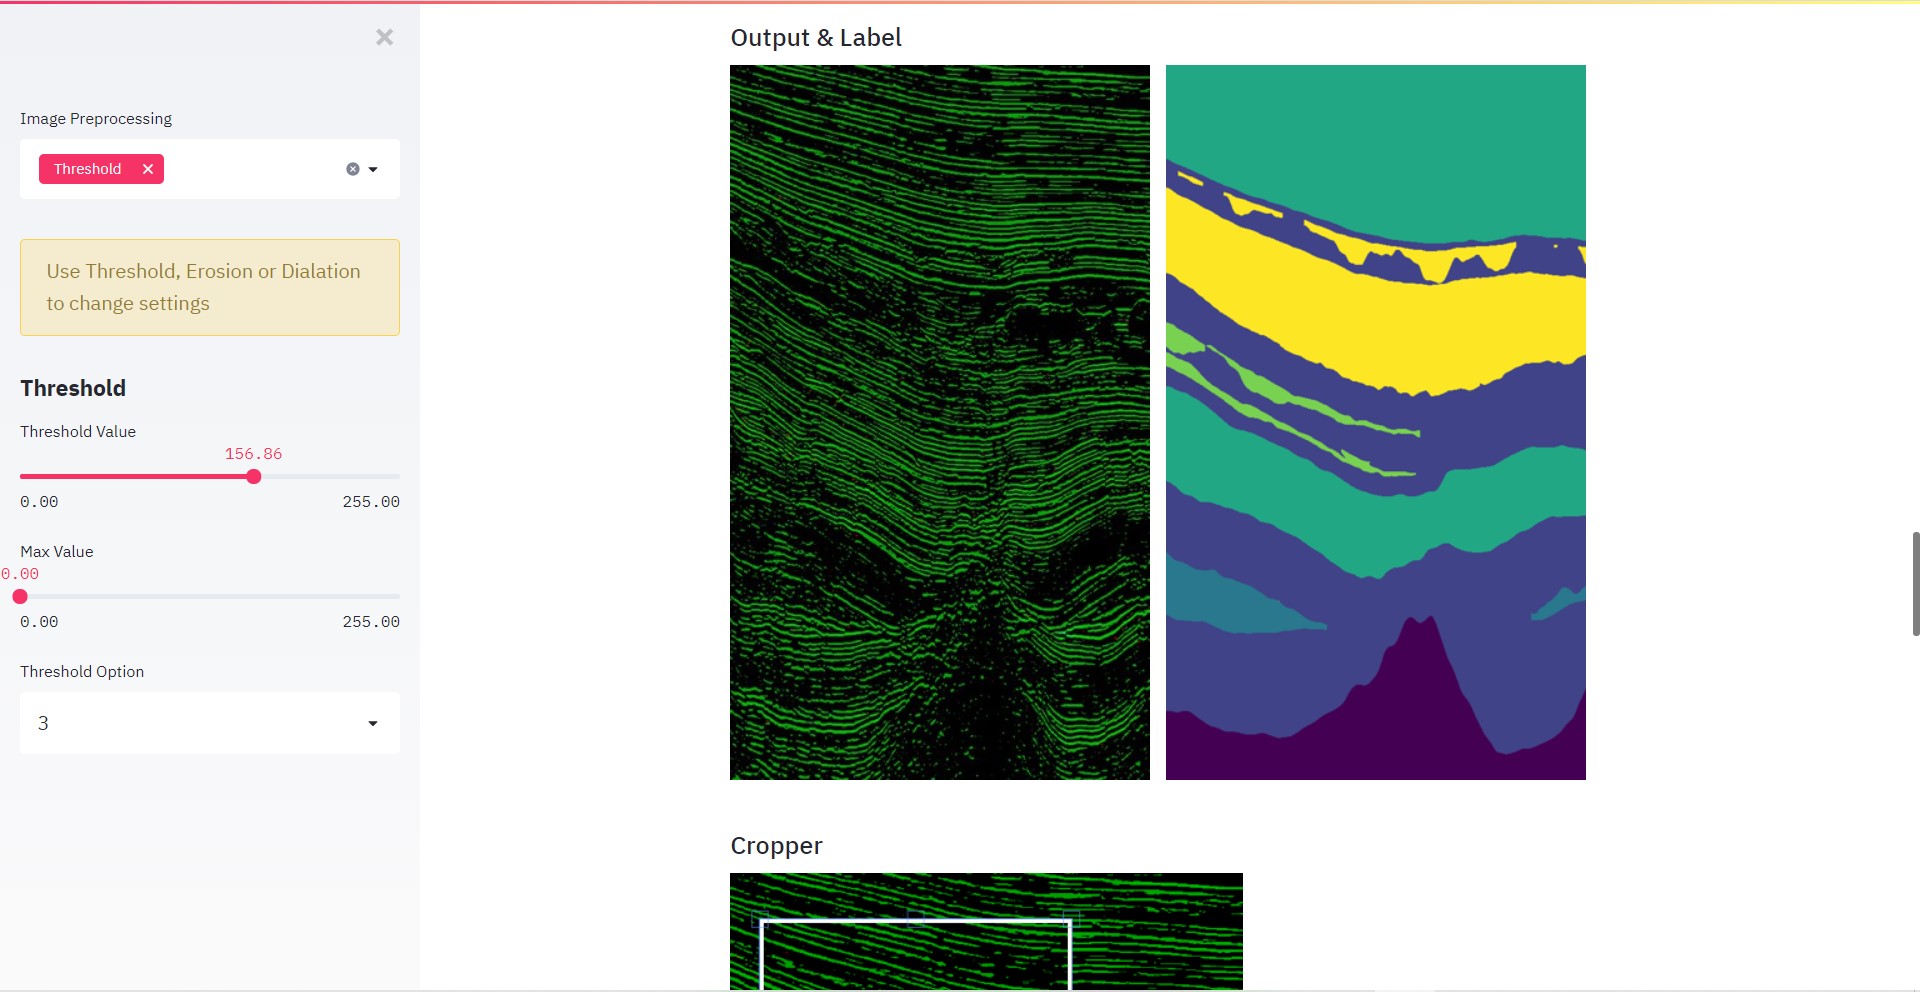
1. Exploratory data analysis

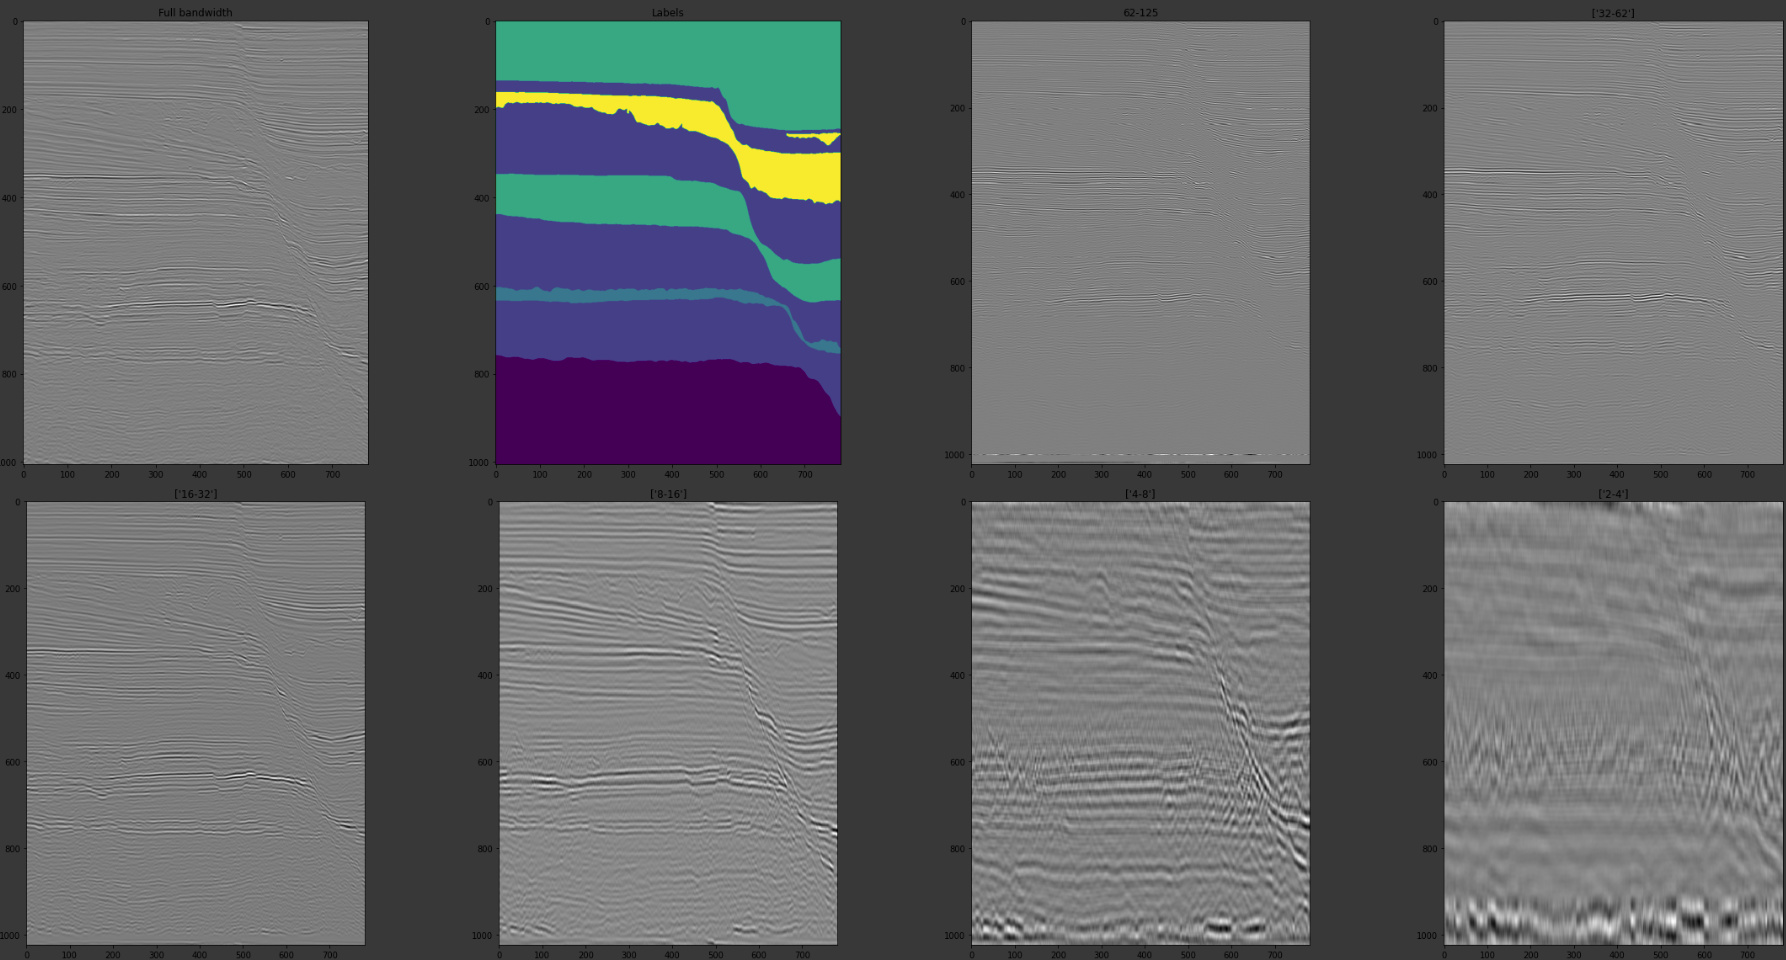
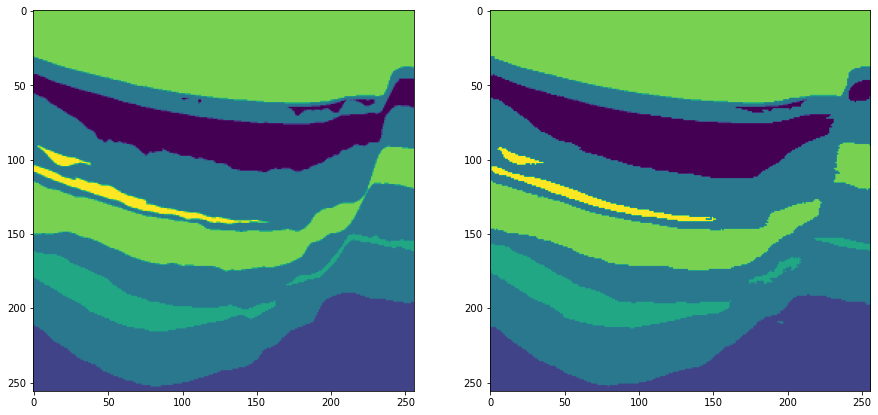
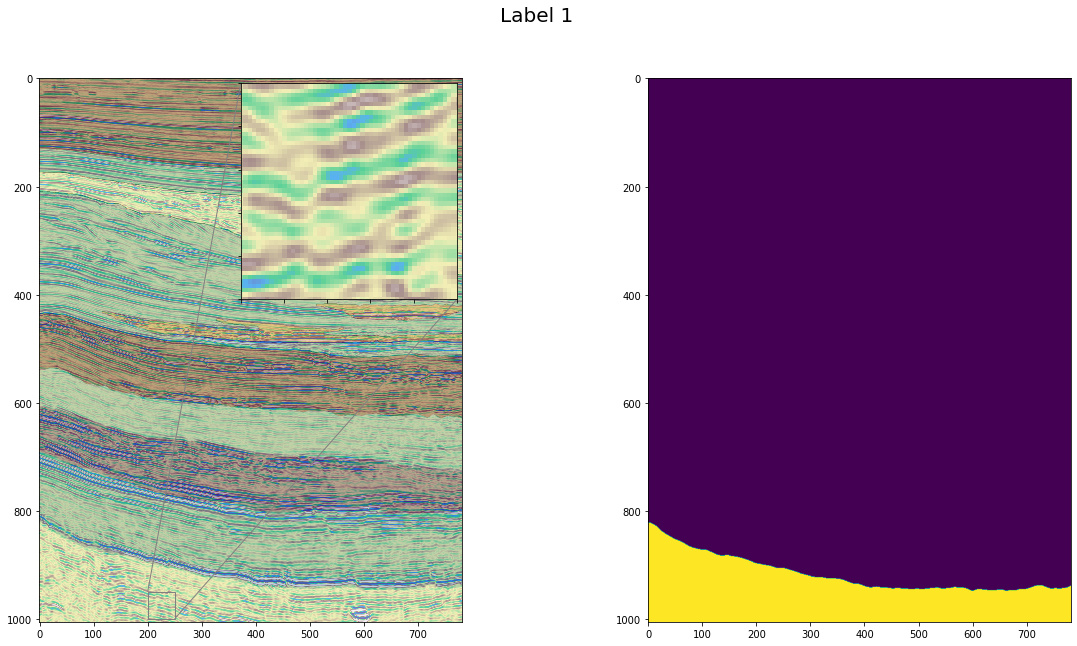
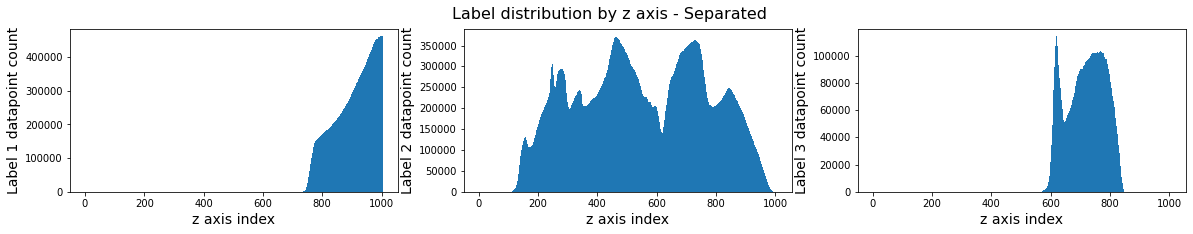
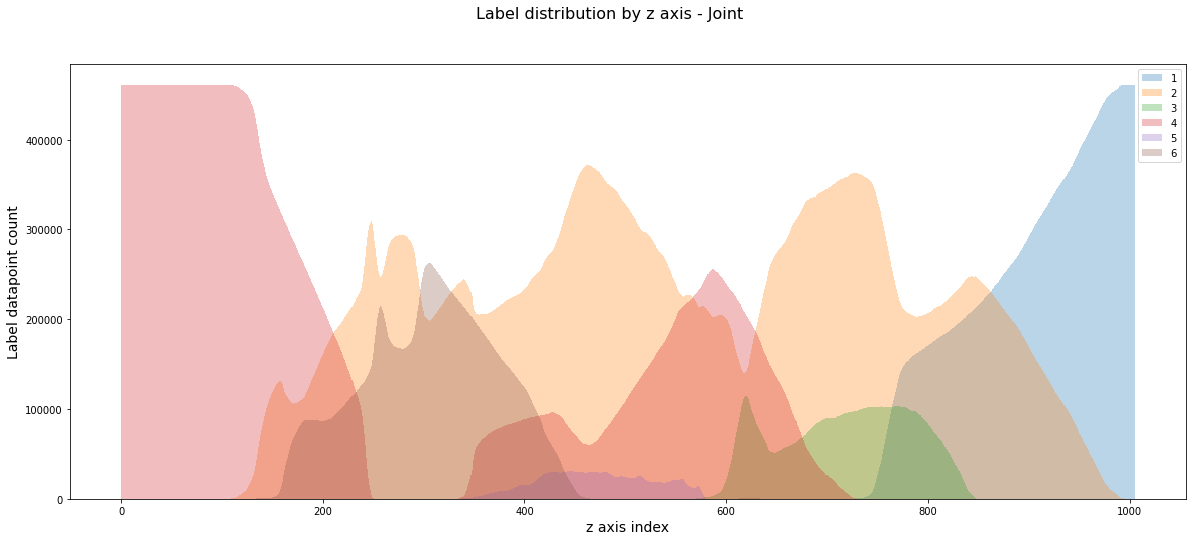
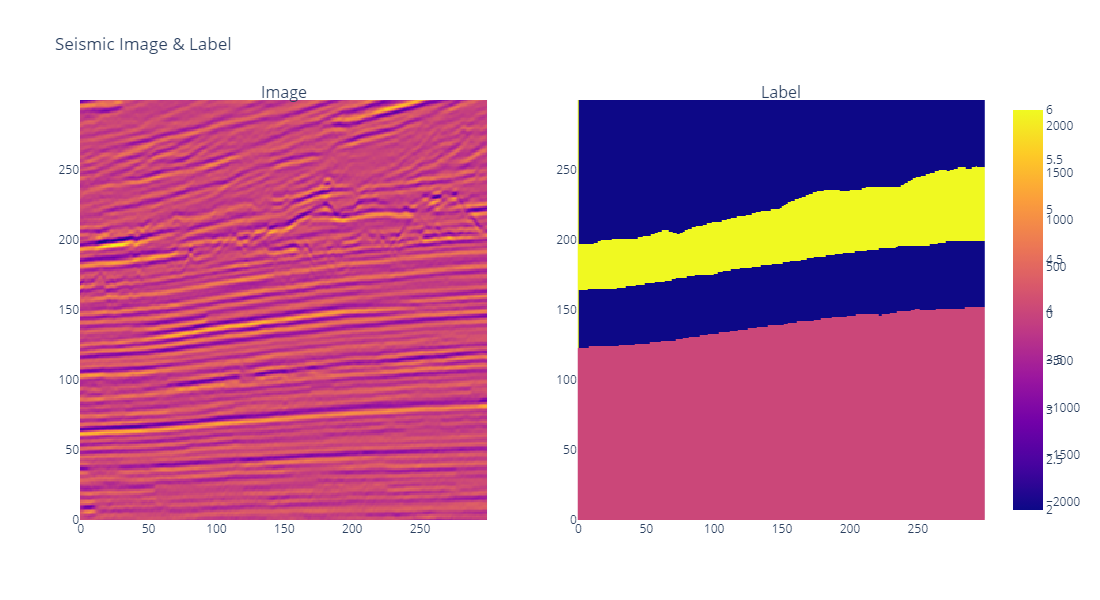
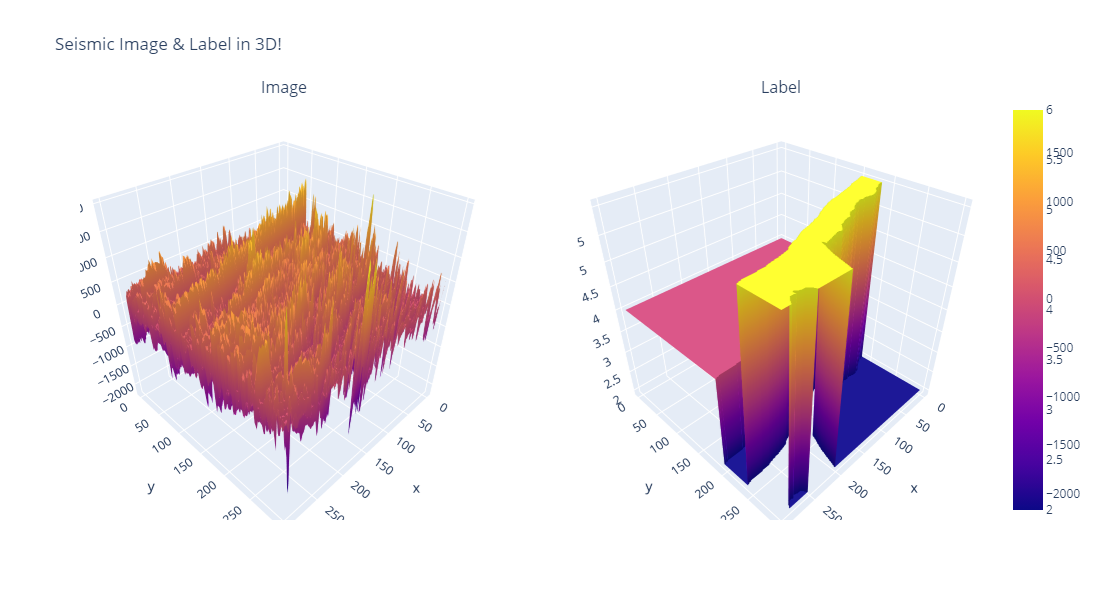
We can extract a ton of information just by looking at the cubes from various axes: it is an invaluable insight into the data itself. As my specialization is horizon detection, I tried to look at borders between facies and analyze them. As was already mentioned by other participants, facies picking is very subjective; yet, I was able to find interesting patterns of labeling that can be used for the improving models.

Overall, it is pretty much the same as in any other contest: check the distributions, create visualizations, get familiar with the data itself.

Placeholder for a link to an amazing COLAB notebook.

2. Segmentation model

The next notebook shows everything for submission creation:

  • Data loading: generating data along both spatial axis
  • Applying a few image-related augmentations
  • NN architecture with all the training hyperparameters
  • Validation on left-off data
  • Sequential prediction on the test data and storing the prediction in the needed format

There are quite a few parameters that can be changed: from the architecture to the way we generate data during the training phase. There is also an ever-present question of whether to add seismic attributes to the model input or just hope that a huge neural network can figure our everything it needs on its own. All of these variables can have a huge impact on the outcomes and the scoring of the submission!

Placeholder for a link to an amazing COLAB notebook.


That is it for now! I will try to update every section with new insights and put everything to the COLAB as soon as possible. Feedback, suggestions and criticism is always welcome!

It is also worth mentioning, that we have a lot of articles and talks and conferences on the subject: right now, we are in the middle of running EAGE workshop on ML in Oil&Gas. If you are interested in any of this, be sure to contact us!

15 Likes

Sure! Thanks for the suggestion :slightly_smiling_face:. I will make changes to the color map soon!

Hello Everyone!

Me Shubhamai, Machine Learning Engineer, and I am excitedly working on this competition because especially it a kind of 3D problem rather than 2D. Previously I made the complete google colab notebook from data exploration to submission. You can find the notebook here.

But this time, I found that a great preprocessing pipeline can help to model to find accurate features and increasing overall accuracy. But it kinda isn’t that easy as it looks —

So I made a Web Application based on that which allows you to play/experiment with many of the image preprocessing functions/methods, changing parameters or writing custom image preprocessing functions to experiment.

And it also contains all the visualizations from the colab notebook.

I hope that it will help you in making the perfect preprocessing pipelines and make sure you like the post :slightly_smiling_face: . Thanks

https://seismic-facies-identification.herokuapp.com/

8 Likes

Additional Features with the Stationary Wavelet Transform (SWT)

Hello everyone, I was previously a Senior Geophysicist for a Seismic Processing company and I now work in Deep Reinforcement Learning for robotics. I find this competition really interesting as it combines my previous experience in Geophysics with my current area of research, Deep Neural Networks.

Here in this Colab Notebook I demonstrate the use of the Stationary Wavelet Transform (SWT) to perform a frequency based decomposition (filter banks) on the input time series data. For my submission I have used this as input to a UNET architecture, written in PyTorch. I would be happy to share the UNET implementation if this post gets some attention.

Best of luck with the competition!

4 Likes

it did’nt help , please can you explain more on this topic i am very new with this

Seismic facies identification refers to the interpretation of facies type from the seismic reflector information. The key elements used to determine seismic facies and depositional setting are bedform internal and external configuration/geometry, lateral continuity, amplitude, frequency, and interval velocity.

The classification of seismic facies is an important first step in exploration, prospecting, reservoir characterization, and field development.

Classification and interpretation of depositional facies from the chronostratigraphic units can provide initial indication as to whether the area of interest is a viable hydrocarbon system and merits additional research.

Furthermore, seismic facies classification can help in the approximation of grain size, sorting, mineralogy, porosity distribution, and permeability of the various deposition units.

When combined with open hole logging data, DHI, and advanced processing such as AVO, it is possible to estimate recovery and the potential for an economically viable prospect.

In modern seismic interpretation workflows, seismic facies classification is often automated or partially automated using computer algorithms, such as clustering and supervised learning.

Many of them here explored the data ( Visualization ) very well, so i try to contribute an end to end solution which helps some people.

Colab Link of end 2 end solution -

https://colab.research.google.com/drive/15gPM_RLorlRNWGUgwcGdeRcpxEk2F4U0?usp=sharing [updated]

Above solution that handle ->

  1. Loading the data
  2. Divide and Stack
  3. Resize the data
  4. Design UNet
  5. Train the data
  6. Predict the test data
  7. Submission.npz

This solution gives 67% acc on test data and its not very optimized one. :yum:

Github Link -> https://github.com/saikrithik/Seismic-Facies-Identification-Challenge/blob/main/Seismic_Facies_Identification_Challenge_BASELINE.ipynb

Few things we can tryout ->

  1. Augumenting the data
  2. Chunking and training insead of resizing the data
  3. PSPNet, FPN ( other networks ) :wink:
  4. Applying different filters

USEFULL NOTEBOOKS -

  1. https://github.com/qubvel/segmentation_models/blob/master/examples/multiclass%20segmentation%20(camvid).ipynb

  2. [https://github.com/thurbridi/cnn-facies-classifier/blob/master/notebooks/scratchpad.ipynb]

  3. https://github.com/jayaramanjay97/AI_Crowd_Blitz_-3/blob/master/LNDST/LNDST.ipynb

  4. https://github.com/rekalantar/CT_lung_3D_segmentation/blob/master/CT_lung_segmentation.ipynb

  5. https://github.com/ViiSkor/VolumMedSeg/blob/master/notebooks/train_UNet_BRATS2019.ipynb

USEFULL LINKS -

  1. https://github.com/frankkramer-lab/MIScnn [ 3D / 2D ]

    The open-source Python library MIScnn is an intuitive API allowing fast setup of image segmentation pipelines with state-of-the-art convolutional neural network and deep learning models in just a few lines of code.

  2. https://github.com/microsoft/seismic-deeplearning

  3. https://github.com/JesperDramsch/seismic-transfer-learning

  4. https://github.com/wolny/pytorch-3dunet

  5. https://github.com/goodok/fastai_sparse

  6. https://github.com/arnab39/FewShot_GAN-Unet3D

  7. https://github.com/black0017/MedicalZooPytorch

  8. https://github.com/anindox8/Ensemble-of-Multi-Scale-CNN-for-3D-Brain-Segmentation

  9. https://github.com/ShouYuqing/3D-UNet-for-Segmentation

  10. https://github.com/fitushar/3DUnet_tensorflow2.0

  11. https://neptune.ai/blog/image-segmentation-tips-and-tricks-from-kaggle-competitions

  12. https://github.com/nikhilroxtomar/Deep-Residual-Unet

  13. https://github.com/nikhilroxtomar/Polyp-Segmentation-using-UNET-in-TensorFlow-2.0

  14. https://github.com/shivangi-aneja/Multi-Modal-Brain-Segmentation

  15. https://github.com/ardamavi/3D-Medical-Segmentation-GAN

FEW RECENT PAPERS-

  1. https://www.researchgate.net/publication/326307470_Deep_Learning_Applied_to_Seismic_Facies_Classification_a_Methodology_for_Training

  2. https://www.researchgate.net/publication/281783417_A_comparison_of_classification_techniques_for_seismic_facies_recognition

  3. https://library.seg.org/doi/10.1190/geo2019-0627.1

  4. https://ieeexplore.ieee.org/abstract/document/8859617/

  5. https://ieeexplore.ieee.org/abstract/document/9025426/

  6. https://link.springer.com/article/10.1007/s12517-014-1691-5

  7. https://hanyang.elsevierpure.com/en/publications/facies-classification-using-semi-supervised-deep-learning-with-ps

  8. https://arxiv.org/pdf/1901.07659.pdf

Thanks to the people who contribute that help us to learn more and also big thanks to aicrowd for these amazing challenges :blush:

27 Likes

Hi Thanks a lot for the notebook. I wanted to ask why have you first reshaped your samples into 2012, 782, 295. Thanks a lot :slight_smile:

3 Likes

Seismic data here is a recording of earth vibration amplitude. By making vibration at the surface, we then records the reflection of that vibration by earth facies in the subsurface.
The processed data which shows vibration high amplitude (bright) that looks like a border line is where we usually make manual interpretation (though sometimes its not as simple as that and most of the time it’s subjective). If you do the data exploration and see the distribution, (I hope you did or at least read some of the guys wonderful works here), you see it’ll be not enough to use the amplitude as it is (or at least it’s for me).

Surely you can’t just use only seismic attribute to solve this ML problem, making the high accuracy is the result of a lot of things combined.

P.s. any geoscientist here pls don’t bash me, I am just trying to simplify some terms so its easier to understand. haha.

Just a simple notebook

Hi there! I am a recently graduated geophysicist from Argentina. I got into Data Science and Machine Learning just a few months ago, so I’m certainly an inexperienced little tiny deep learning practitioner as you may well guess.
Here are some questions you may ask yourselves…

What is this challenge?

This challenge tries to overcome something that has troubled the Oil&Gas industry for so many years: how can I interpret such huge amount of information in so little time?
Seismic facies are one of the abstractions that are regularly used to compress the amount of information. We define that certain patterns in the seismic image are defined by the response of a certain layer, this layer, when grouped with several other layers with the same characteristics, tend to generate a response that stands out from other patterns in the seismic image.
This common response helps grouping these layers that behave similarly, and thus helping reducing the amount of information on image.
But how do we group all these patterns together?! Well, Deep Learning to the rescue!

Let’s dive in:

What did you do?

The last few hours I’ve tried to put together a simple notebook that goes from showing some simple seismic attributes, to implementing a deep learning model.

A couple of examples from the notebook:
TECVA seismic attribute

RMS seismic attribute

How did you do it?

I started by using my seismic attributes knowledge, then I tried to think of a way of implementing different kinds of information, and finally, I used the keras-image-segmentation package that you can find here: https://github.com/divamgupta/image-segmentation-keras to produce a model, train it, and generate the final predictions.

Sample image of the results of training the net (label set / trained set):

Well, but I could have done that on my own!..

Well, of course you could! But beware that I also try to give an insight on some facts over using this seismic dataset and how you may improve your results by taking this into account. Maybe it will help you!

I don’t really know about these seismic facies and stuff…

Well, maybe you just like to watch at some random guys’ notebook and you’ll probably like those nice images!

LINK TO THE NOTEBOOK: https://colab.research.google.com/drive/1935VS3tMKoJ1FbgR1AOkoAC2z0IO9HWr?usp=sharing

You can also get in touch via Linkedin (link to the post with this notebook)!:

Hope you guys find it useful, funny and if you did, maybe consider giving it a thumbs up!

See you around!

15 Likes

Hello @hannan4252 we have updated the Notebook with the reasoning of our approach, please check it now.

Thank you,
Krithik

1 Like

A Noob Code-First Notebook

Open In Colab

The title is self-explanatory. Nothing too major, just some visualizations and a baseline model that we hope can help all those looking to start out.

Some really cool 3D visualizations for you to interact and play around with. Geologists in the community, looking to you to make more sense of the data and maybe even share some insights before the challenge ends :wink:.

Here’s a sneak peak!

Check out the code here: https://colab.research.google.com/drive/1obka8aIo5zD4eJ96_FvCNdygNhXVUWOA#scrollTo=c9R9ZyYR9gCH

Hope this helps!

9 Likes

Hi all!

This Community prize has been terrific! We have had many serious and insightful submissions from many people from different domains. The deadline for this challenge will be extended and you will have more time to improve your submissions! (We will update you on the new deadline soon)

There is a lot of activity on this page and if it continues like this, it would become very hard for everyone to track the conversations. Keeping that in mind, we request all the Community prize participants to create a new independent post on the challenge discourse page, under the tag ‘explainer’ and continue the conversations there.

We will take note of all the ‘likes’ at both places and be assured that they will not be lost.

cc’ing all the current participants: @leocd @Shubhamai @sergeytsimfer @edward_beeching @dills @santiactis @shraddhaa_mohan

2 Likes

EDA on facies variation by geographic axis

Here’s my EDA notebook on how the seismic data varies by geographic axis, along with some ideas for training.

A peek some of the stuff in the notebook

How the patterns look per label:

How the facies vary by z-axis


Splitting the data for training based on the EDA results

Do share your feedback. :blush: I’ll try to add training code soon.

The full colab notebook

Seismic-Facies-EDA - Colab

1 Like

I have added the new notebooks with EDA and baseline models, so be sure to check it out in a separate topic!

explainer

Notebook on COLAB with EDA

Notebook on NBVIEWER with EDA

Notebook on COLAB with baseline model

Notebook on NBVIEWER with baseline model

2 Likes

Here is my minimalistic notebook with 0.857 F1-Score solution

Notebook on COLAB (train + inference)

1 Like

Hi! Thanks for the explainer, helps a lot. Do you have more info on the the dice_loss package you are using?

from dice_loss import *

I cant find it anywhere. Do you have a way to import it?

Thanks in advance,
Arno

1 Like

Thanks arnaud_mercier.

[https://colab.research.google.com/drive/1U7xsZku67n_9l7ktn2hUk6TIc3weILie?usp=sharing]

check this updated version of my colab bro… I added multi dice_loss function here.

1 Like