Hi all,
First, thank you to the organizers for hosting this competition. I think that the problem is well posed and easy to understand, which is what tickled my brain and sent me down a six month rabbit hole. Here are my final reflections on the competition.
-
Phase 1 and Phase 2 were very different experiences for me. During Phase 1, I spent much more time thinking about the problem. I studied the ARC paper/materials and would try to guide agents with my own ideas/hypotheses. Early into Phase 2 I accepted that this was a very ineffective way to make progress on the leaderboard, and that it was better to let the agents follow their own ideas. At that point my job became making sure that they didn’t give up and fully utilized the compute that I provided them.
-
I agree with @marius_binner in his thread that I mostly learned about the weird psychological flaws the current generation of agents possess. The number of times I got “everything is cotuned and you should just focus on increasing residual/wall clock margin to make your submissions safer” had me fighting the urge to engage caps lock. My goal loops were essentially just “lower adj score as much as possible and get top three on the public leaderboard”. Whenever the agents would give up in their goal loops I would remind that there are only two levers to improve score (profitably trade accuracy for util or vice versa) and then instruct them to completely disassemble the current best estimator, holistically look for optimizations, and then re-assemble an improved estimator. I’d also ask them to revisit ideas they rejected in the past and see if any had become more viable on the current iteration of the estimator. They would find a ton of ideas that would either improve accuracy or lower cost but worsen adj. As the estimator evolved some of these ideas would come back into play or they would simply fix a bug that was present on the first N tries they tried to implement the idea.
-
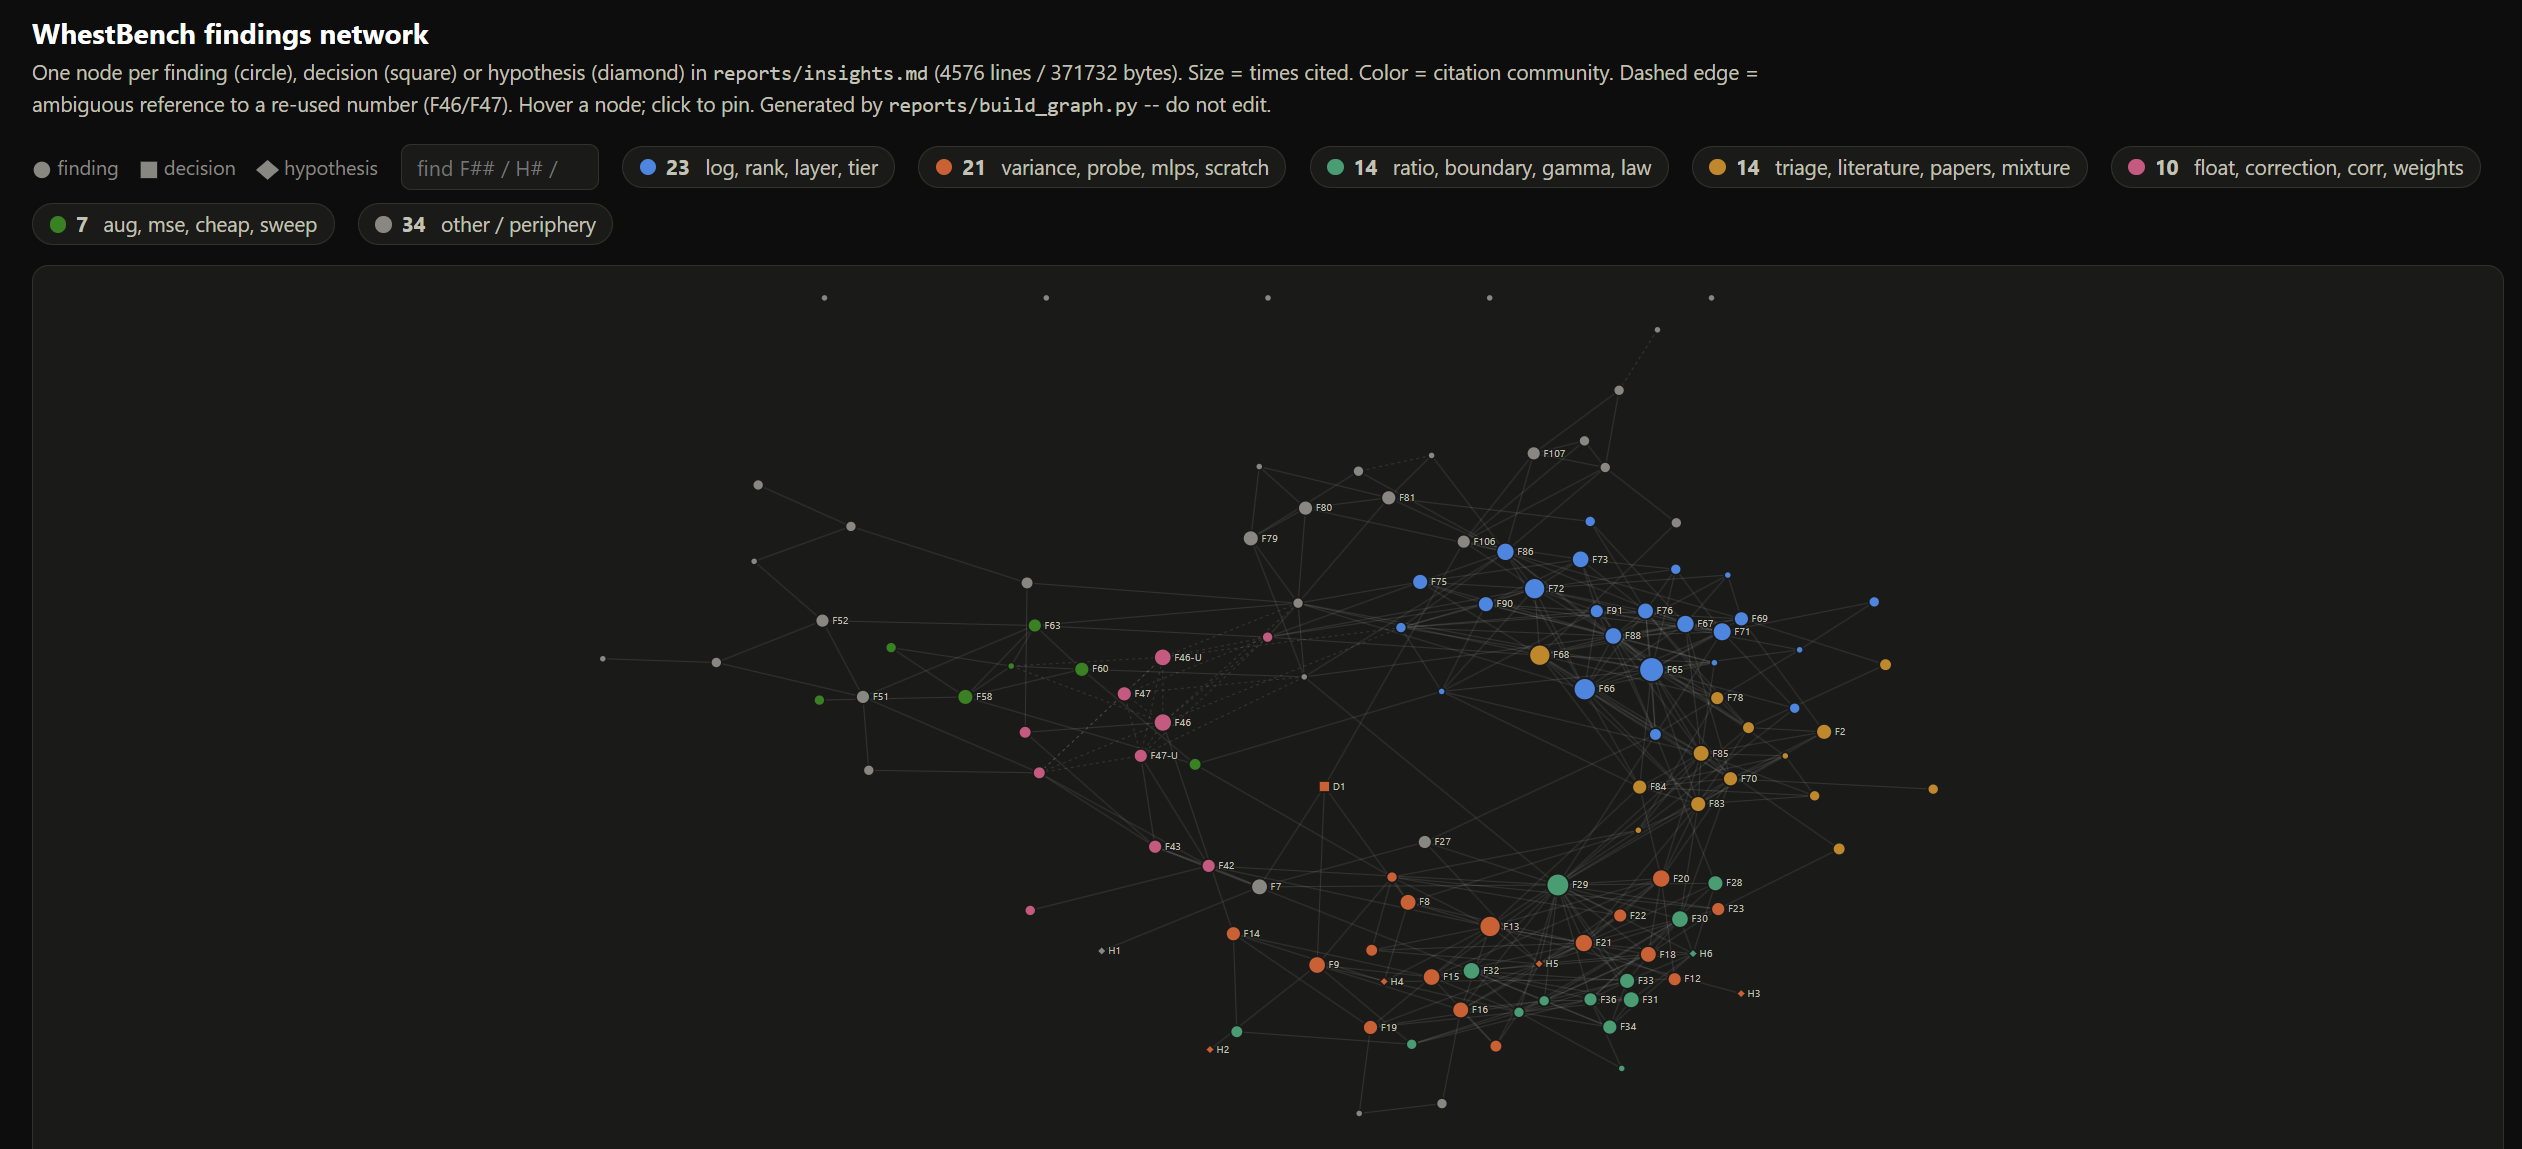
My final estimator code is extremely gnarly. I’ve spent some time over the last couple days organizing the mess of research materials my agents produced and trying to understand the write up. I had my agents create a research graph in an attempt to trace how they got to our best scoring solution. I also asked them to summarize the insights they produced. The theme, as I currently understand it, was finding cheaper ways to carry higher-order statistical information through the network and learning corrections to the intermediate estimates along the way. See the bullets below:
• Representation mattered. Useful fourth-order effects became affordable when we carried them through factors already being transported.
• Low-rank compression helped selectively. Older contributions could share a compact basis, while recent contributions needed more detail. Preserving a linear subspace alone didn’t guarantee preserving the relevant higher-order calculations.
• Learning corrected the evolving estimator. We learned adjustments to intermediate statistics and fitted the final readout on trajectories the estimator actually produced.
• Better local predictions didn’t guarantee a better final answer. Some improvements to intermediate moments or one-step fits disappeared—or became harmful—when tested through the full network.
• Learning also points toward unfinished mechanistic work. Predictable residual errors give us targets for further analysis, although we haven’t yet explained all the learned gains. -
I do not claim to have any deep understanding of the work produced. I think that would require a ton of time and effort. I have no estimate of how much actual scientific value was created. I think the released repository could be a queryable resource that might save some researchers tokens and compute.
All phase 2 materials can be found here for anybody interested in digging through them. Write up is also attached.
Phase 2 write up (mliston) - #337641.pdf (126.2 KB)